Fig. 7.

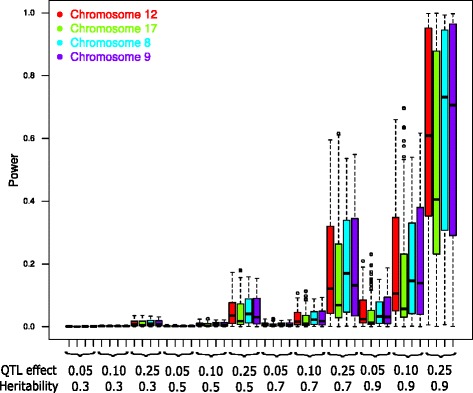
Variation of power distribution within four genomic regions (at a total of 372 SNPs). We used a family wise error rate of 5 %, AIS kinship estimation and various heritability and QTL effect values

Variation of power distribution within four genomic regions (at a total of 372 SNPs). We used a family wise error rate of 5 %, AIS kinship estimation and various heritability and QTL effect values