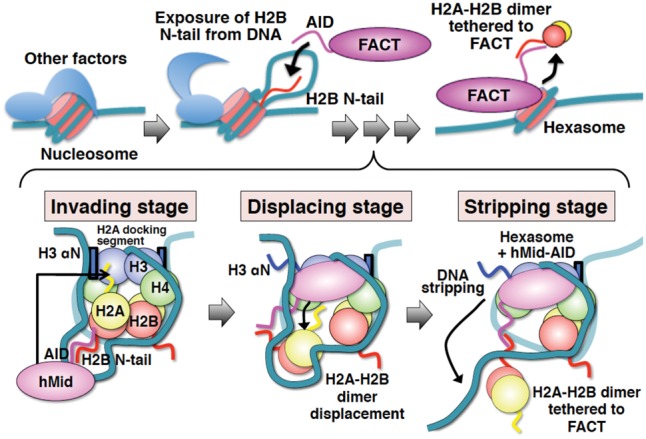
Figure 7.

Schematic diagrams showing the integrated mechanism for nucleosome reorganization by hFACT. Histone proteins and DNA in nucleosomes are indicated by different colors as follows: H2B (red), H2A (yellow), H3 (blue), H4 (green), and DNA (light sea green). FACT, hMid, and AID are each colored in magenta. Blue boxes show the two αN helices of H3. Wavy lines represent the disordered regions of proteins. The invading stage involves speculation, because the corroborative assays (Fig. 1) are based on the assumption that DSB nucleosomes mimic the exposure of internal histones from DNA by other factors. However, the interaction of AID with the H2B N-tail was revealed by our biochemical data (Fig. 6). The displacing stage is entirely supported by our crystal structure and the related biochemical data (Figs. 2, 3, 4, and 5A). At the stripping stage, the DNA stripping is supported by our nuclease susceptibility assays (Fig. 5B,C). On the other hand, the anchoring of H2A–H2B via AID is based on the interpretation that AID simultaneously binds to one H3–H4 tetramer and one H2A–H2B dimer. This interpretation is supported by our biochemical data (Fig. 1F; Supplemental Fig. S8B).
