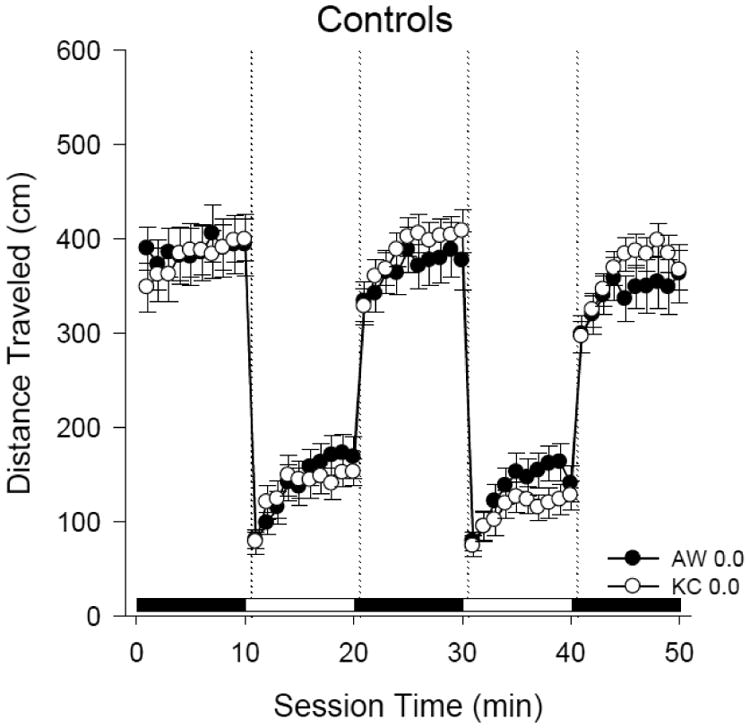
Figure 2. Control larval mobility at 4 days post-hatch in KC and AW killifish.

The line plot shows swimming activity of n = 30 larvae per population. White circles represent Kings Creek killifish and black circles represent Atlantic Wood killifish. Alternating black and white bars on the x-axis signify 10-minute intervals of dark and light exposure in the Daniovision® chamber. Activity levels did not vary between populations.
