
Table 9.
Community College SALGa
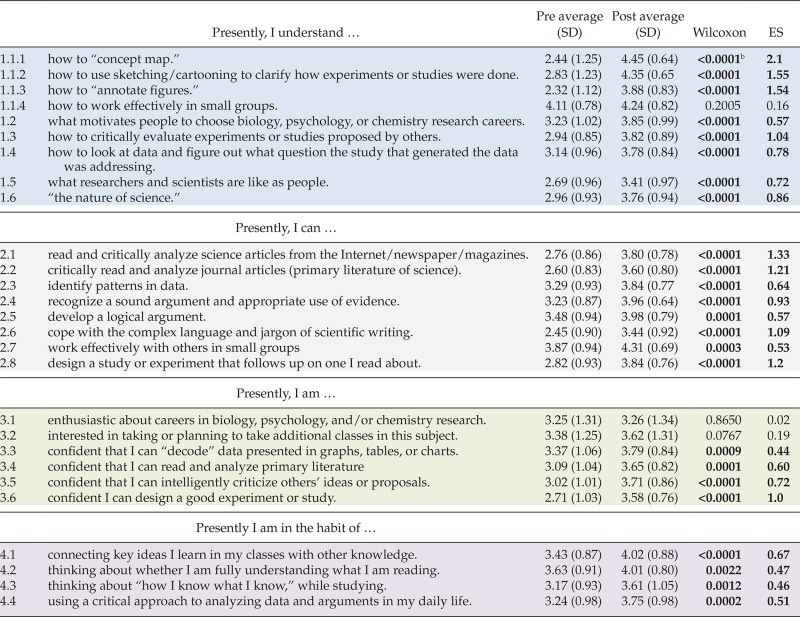 |
aData pooled from five community colleges (n = 79; see Table 3: CC1, CC2, CC3, CC5, CC6). Categories: understanding (blue), skills (gray), attitudes (green), integration of learning (purple).
bBoldface indicates significance at less than or equal to p = 0.05.