
Figure 4.
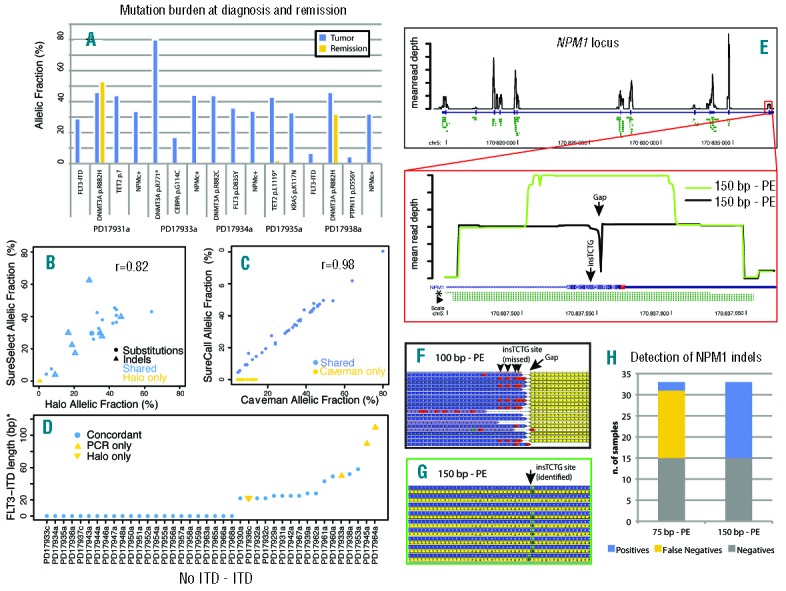
(A) For 5 patients in the study for whom a post-chemotherapy sample was available, the somatic status of 16 variants was checked. The y-axis represents the raw allelic fraction of the variant, and the x-axis represents individual variants, clustered by patient, in the tumor (blue bar) and remission (yellow) sample. Note that DNMT3A R882H persists at a similar allelic fraction in post-chemotherapy samples, independent of the remission status of the patient. Also, the persistence of a low-level TET2 p.L1119* nonsense mutation suggests that patient had a partial molecular response to treatment. (B) For 25 variants, validation data was available from a previous study performed with SureSelect target enrichment. The plot shows the allelic fraction of variants in the HaloPlex study (x-axis) and that of the SureSelect study (y-axis). Variants are represented as solid circles (substitutions) or open triangles (indels), and are blue if shared between the two studies and yellow if only reported by the HaloPlex study. The plot shows good correlation of allelic fraction between the two studies. (C) For the 61 substitutions in the study, two different algorithms were compared (Caveman and SureCall). Shared variants are in blue, variants missed by SureCall are in yellow. For the shared variants, the correlation between allelic fractions is near perfect. (D) For 40 samples in the study (x-axis), FLT3-ITDs are plotted by length (y-axis, value=0 if no ITD present). Variants confirmed by both Pindel and PCR are blue circles, those only found by PCR are yellow upwards triangles, and those only found by NGS are yellow downwards triangles. (E) (Top) Black line shows base-by-base average normalized coverage of the NPM1 gene locus. The NPM1 coding region is shown by a thick blue bar and the UTR regions by a thin blue bar. Predicted amplicons from HaloPlex design are shown in green. (Bottom) Zoomed-in view of NPM1 exon 12. Coverage by 100 bp reads is shown as a black line and leaves a 1-bp gap close to the NPM1c+ insertion site. The amplicon closer to NPM1c+ mutations and allowing their identification is highlighted by an asterisk, while the amplicons where such mutations were missed are marked by an arrowhead. When 150 bp reads are employed (green line), coverage of the middle region increases. (F) Aligned reads from a 100 bp sample where the mutation was missed because of short read length leaving a gap in coverage (arrow). Yellow: reverse reads. Blue: forward reads. The presence of the indel must be deducted by the BWA calls (red boxes, arrowheads). (G) Aligned reads from a 150 bp sample where the mutation was identified. Yellow: reverse reads. Blue: forward reads. The insertion is identified by Pindel as green boxes (arrow). (H) Stacked bar chart showing the increase in sensitivity of Pindel for detection of NPM1 indels with a 150 bp protocol.