
Figure 5.
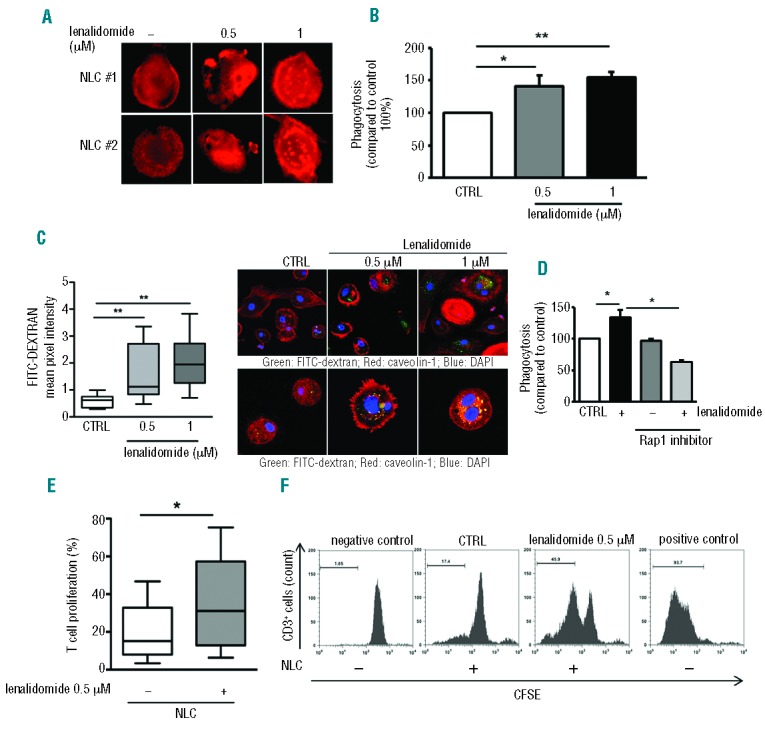
Lenalidomide enhances phagocytosis and the ability to stimulate T-cell proliferation in NLCs. (A) Actin polymerization was strongly increased in NLCs after treatment with lenalidomide in one representative CLL patient. F-actin content was inspected by rhodamine-phalloidin staining. (B) NLCs obtained from 6 CLL patients were treated or not with lenalidomide 0.5 μM and 1 μM for 4 h, followed by phagocytosis assay. Data represent mean±SEM of 6 independent experiments (Student t-test, *P<0.05, **P<0.01). (C) Box plots summarize FITC-Dextran uptake by NLCs treated or not with lenalidomide relative to 8 independent experiments; whiskers show min and max values (Student t-test, **P<0.01). (Right) First row shows confocal staining of NLCs with FITC-dextran, phalloidin and DAPI; second row shows FITC-dextran, caveolin-1 and DAPI staining. (D) NLCs generated from 3 CLL patients were treated or not with Rap1 inhibitor (GGTI) for 30 min and then stimulated with lenalidomide 1 μM for 4 h. Rap1 inhibitor affects lenalidomide-induced phagocytosis in NLCs. Histogram shows mean±SEM of 3 independent experiments (Student t-test, *P<0.05). (E and F) T cells from healthy donors were cultured on NLCs treated or not with lenalidomide 0.5 μM overnight. CD3+ cell proliferation was measured after 7 days by CFSE staining. (E) Box plot shows the improvement in T-cell proliferation (as %CFSE-low CD3+ cells) on lenalidomide-treated NLCs (Student t-test, n=6, P<0.05). (F) Representative histograms show CFSE proliferation profiles of healthy T cells cultured onto NLC layer pre-treated or not treated with lenalidomide overnight. T cells cultured alone for seven days or stimulated with αCD3/CD2/CD28-coated beads are shown as negative and positive controls, respectively.