
Figure 6.
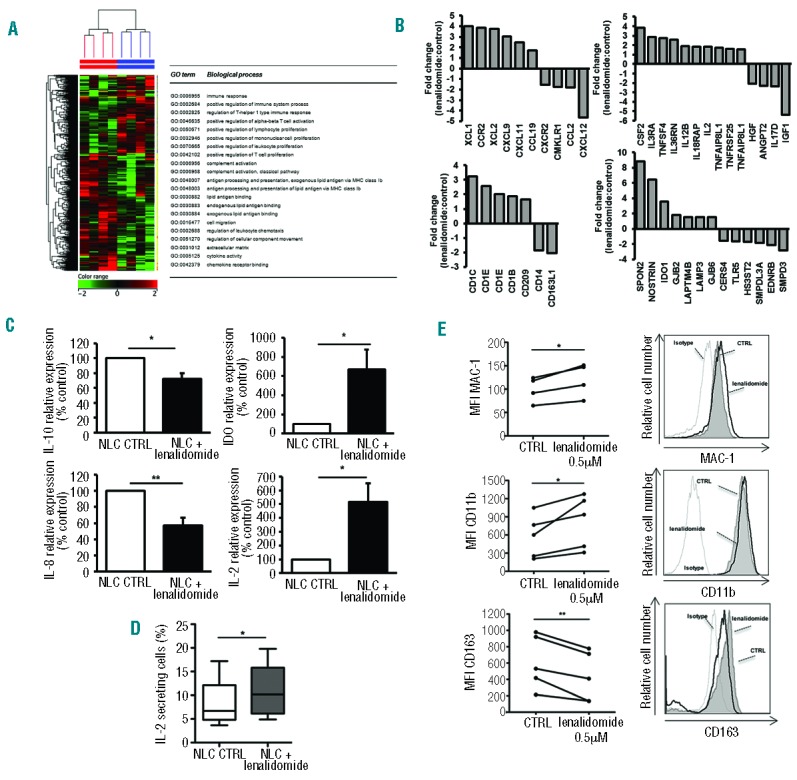
Lenalidomide induces pro-inflammatory modification in NLCs. (A) Heat map shows differentially expressed genes between NLCs treated and not treated with lenalidomide for ten days. (B) Histograms represent fold change of normalized intensity values of genes expressed in NLCs treated with lenalidomide 0.5 μM to untreated control. (C) Histograms represent the mRNA relative quantity of IL2, IL10, IDO1, IL8 evaluated by RT-PCR in NLCs obtained from 7 CLL patients (Student t-test, *P<0.05, **P<0.01). (D) Box plots show the percentage of IL-2 secreting cells in NLCs populations treated or not with lenalidomide for 10 days relative to 4 independent experiments; whiskers shown min and max values (Student t-test, *P<0.05). (E) Histograms show the fluorescence intensity of NLCs after treatment with lenalidomide stained with anti-MAC1, anti-CD11b and anti-CD163 Abs in one representative sample. (Left). Values of untreated and treated samples (n=5) are connected by lines (Student t-test, *P<0.05, **P<0.01).