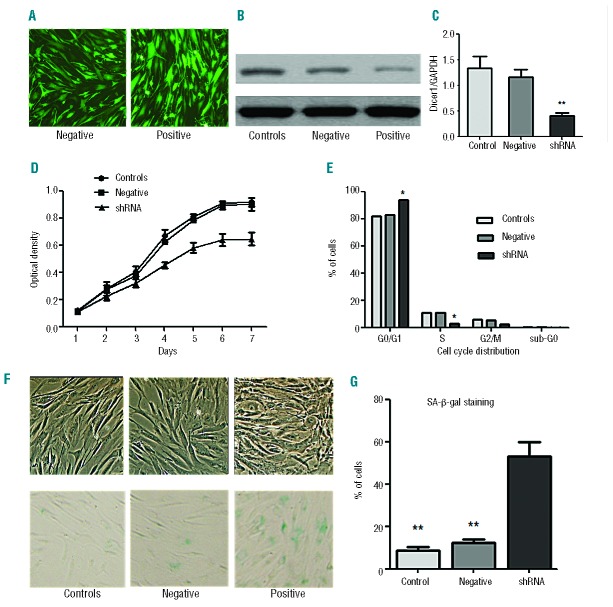
Figure 5.
Dicer1 knockdown-induced cellular senescence of MSC. (A) Transfection efficiency under the fluorescence microscope. (B, C) Dicer1 shRNA decreased Dicer1 expression in MSC, as determined by western blotting (B) and RT-PCR analyses (C). (D) The cell proliferation capacity was measured by CCK-8 assay. (E) Cell cycle analysis of Dicer1-KD MSC by FACS. (F) Representative micrographs depict the morphologies of Dicer1-KD MSC (shRNA), negative MSC (transfected with control lentiviruses) and control-MSC (HC-MSC without transfection) and also show SA-β-gal staining (100 × magnification). (G) One hundred MSC per sample were counted using light microscopy, and the percentages of SA-β-gal-positive cells were determined. The average of three replicates is displayed. Compared with controls, the significance was set as *P≤0.05; **P≤0.001.

