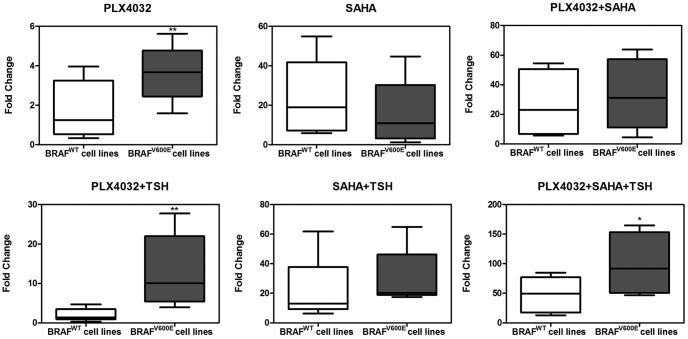
Figure 3.
Increased NIS expression over control in response to PLX4032, SAHA and TSH in thyroid cancer cells: BRAF V600E-dependent effect of PLX4032. Box plots are used to show the fold changes of NIS expression in response to the indicated treatment over control (DMSO only). Shown in each panel are results in two groups of cells: four cells harboring the wild-type BRAF (BRAFWT) (C643, FB1, FTC133, and TPC1) and four cells harboring BRAF V600E (BRAFV600E) (SW1736, OCUT1, K1, and BCPAP). The outer bars of the box plots indicate the range of minimum and maximum values, and the bold line indicates the median value. Compared with the wild-type BRAF group, the BRAF V600E group was generally associated with higher responses, particularly robustly with PLX4032 plus TSH or PLX4032 + SAHA + TSH. The cell treatment conditions and concentrations of the agents are as described in the legend to Figure 2. *, P < .05, **, P < .01 for comparison between the wild-type BRAF and BRAF V600E groups.

