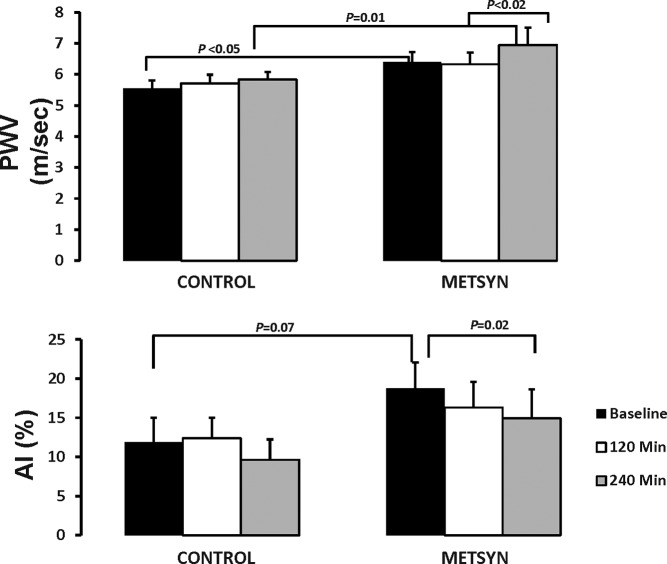
Figure 3.
The upper panel illustrates the PWV at baseline, 2 hours after ingesting the HFM and 2 hours later at the end of the insulin clamp. Control subjects are on the left, and metabolic syndrome on the right. The lower panel shows the AI at these same time intervals for the control and METSYN subjects. Comparison across groups was done with a two-way ANOVA and within-group comparisons with a paired t test.

