
Figure 2.
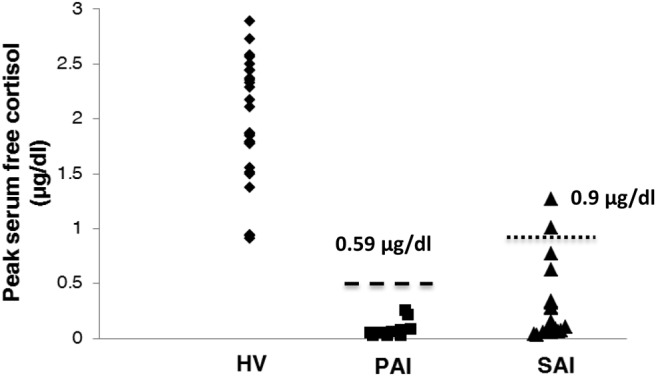
Cutoff values to discriminate between HVs and patients with PAI or SAI. The lower (0.6 μg/dL) and higher (0.9 μg/dL) dashed lines represent cutoff values to determine the healthy volunteers from patients with PAI and SAI, respectively.
Official websites use .gov
A
.gov website belongs to an official
government organization in the United States.
Secure .gov websites use HTTPS
A lock (
) or https:// means you've safely
connected to the .gov website. Share sensitive
information only on official, secure websites.
Cutoff values to discriminate between HVs and patients with PAI or SAI. The lower (0.6 μg/dL) and higher (0.9 μg/dL) dashed lines represent cutoff values to determine the healthy volunteers from patients with PAI and SAI, respectively.