Figure 1.
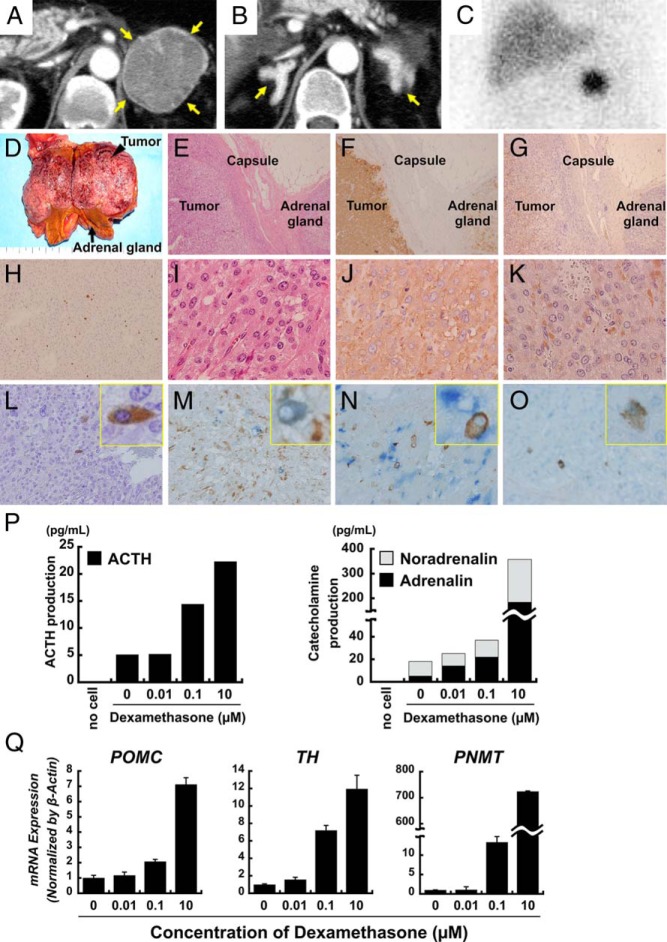
Imaging studies. A and B, Contrast-enhanced CT revealed a 54 × 51-mm left adrenal tumor (A) and bilateral adrenal enlargement (indicated by yellow arrows) (B). C, I123-metaiodobenzylguanidine scintigraphy identified a focal region of intense uptake in the left adrenal tumor. D–O, Pathological findings of pheochromocytoma lesions and attached adrenal tissue in the left adrenal gland. Macroscopic view of the patient's tumor and attached adrenal gland. The adrenal tumor was 53 × 40 × 40 mm, as indicated by the black arrowhead. D, The attached adrenal gland was significantly enlarged (black arrow). E–G, A low-magnification view of the tumor and adjacent adrenal gland. E, Hematoxylin and eosin staining. F, Immunostaining of synaptophysin (in brown). G, Immunostaining of chromogranin A (in brown). H–L, Magnified views of the tumor. H, Ki67 labeling index. I, Hematoxylin and eosin staining. J, Immunostaining of synaptophysin (in brown). K, Immunostaining of chromogranin A (in brown). L, Immunostaining of ACTH (in brown). M–O, Double-immunostaining also was performed, and magnified views are shown with a representative image of a positive cell in the yellow box insets. M, Double-immunostaining for ACTH and chromogranin A revealed expression of chromogranin A (in brown) in ACTH-positive cells (in blue). N, Double-immunostaining for ACTH and TH revealed that ACTH- (in brown) and TH- (in blue) positive cells do not appear to overlap. O, Double-immunostaining for ACTH and GR revealed diffuse expression of GR (in blue) in most tumor cells, including ACTH-positive cells (in brown). P and Q, Effect of dexamethasone on secretion of ACTH and catecholamine from tumor cells in vitro. P, Secreted hormone levels after treatment in tumor cell medium (ACTH concentration on the left, catecholamines on the right). Q, Dose-dependent effect of dexamethasone on the induction of the indicated mRNAs as determined by RT-qPCR.

