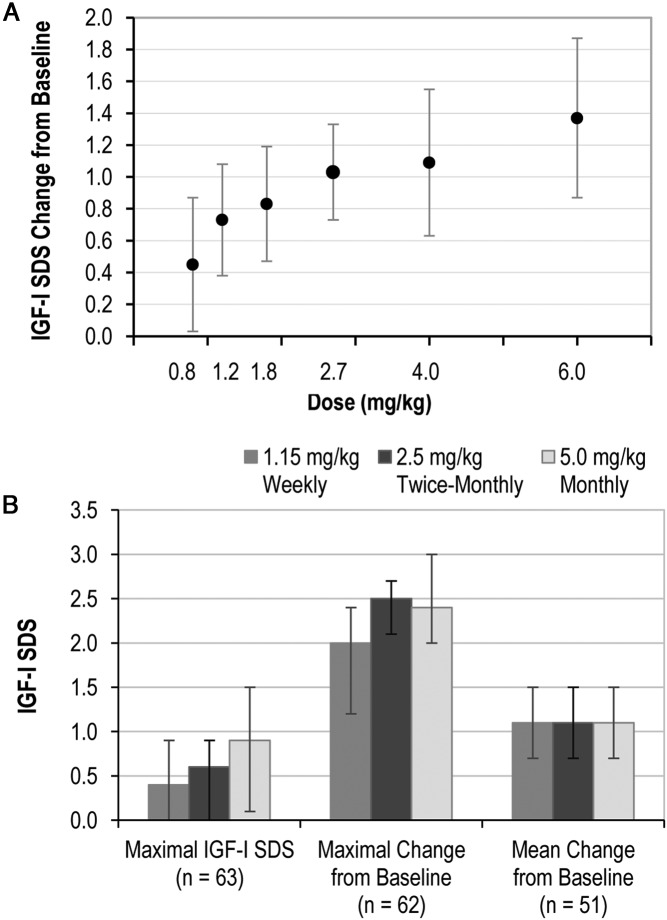
Figure 2.
IGF-1 SDS. A, Dose proportional increase in the average IGF-1 SDS change from baseline in phase 1b. The change in IGF-1 SDS was computed as the numerical average of samples drawn at days 4, 8, 15, 22, and 30. B, Phase 2a IGF-1 responses: maximal IGF-1 SDS, maximal change from baseline, and mean change from baseline. Values are means, and bars represent interquartile ranges. Changes were computed from the average values on days 4, 8, 15, 22, and 30. Sample sizes represent patients who had complete sample collections and no missing samples.

