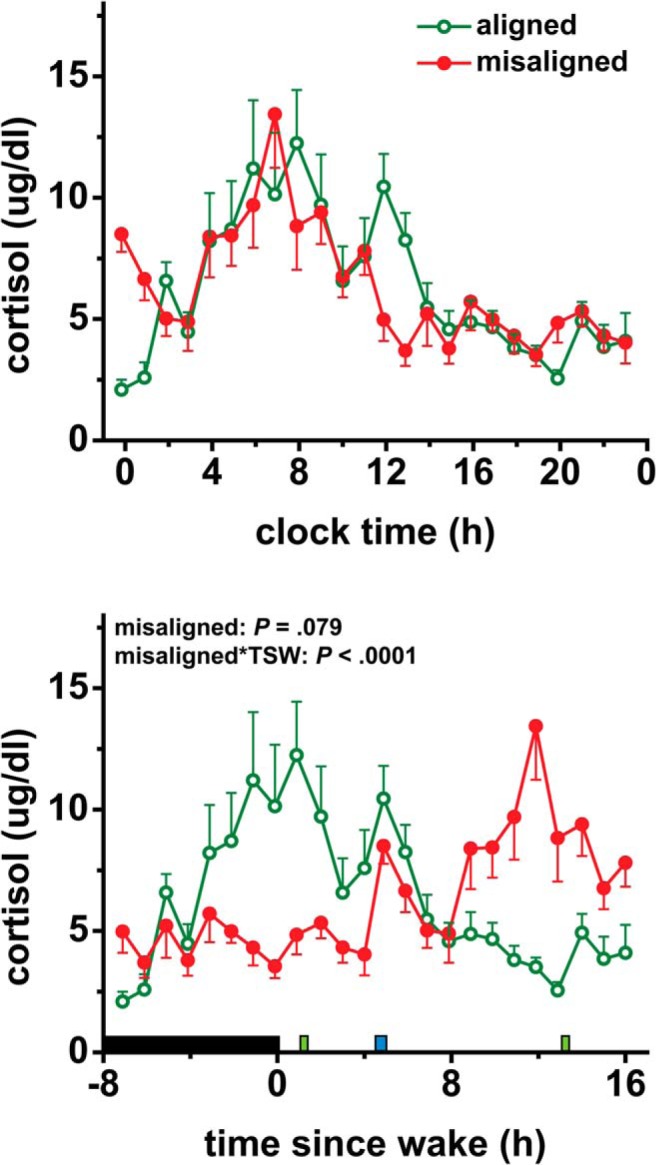
Figure 5.

Effects of circadian misalignment on 24-hour cortisol levels. Upper panel, data are plotted according to clock time. Bottom panel, data are plotted relative to scheduled wake time. TSW, time since wake; black bar represents sleep opportunity; narrow green bar represents a test meal; narrow blue bar represents a lunch meal. Data are represented as mean ± SEM.
