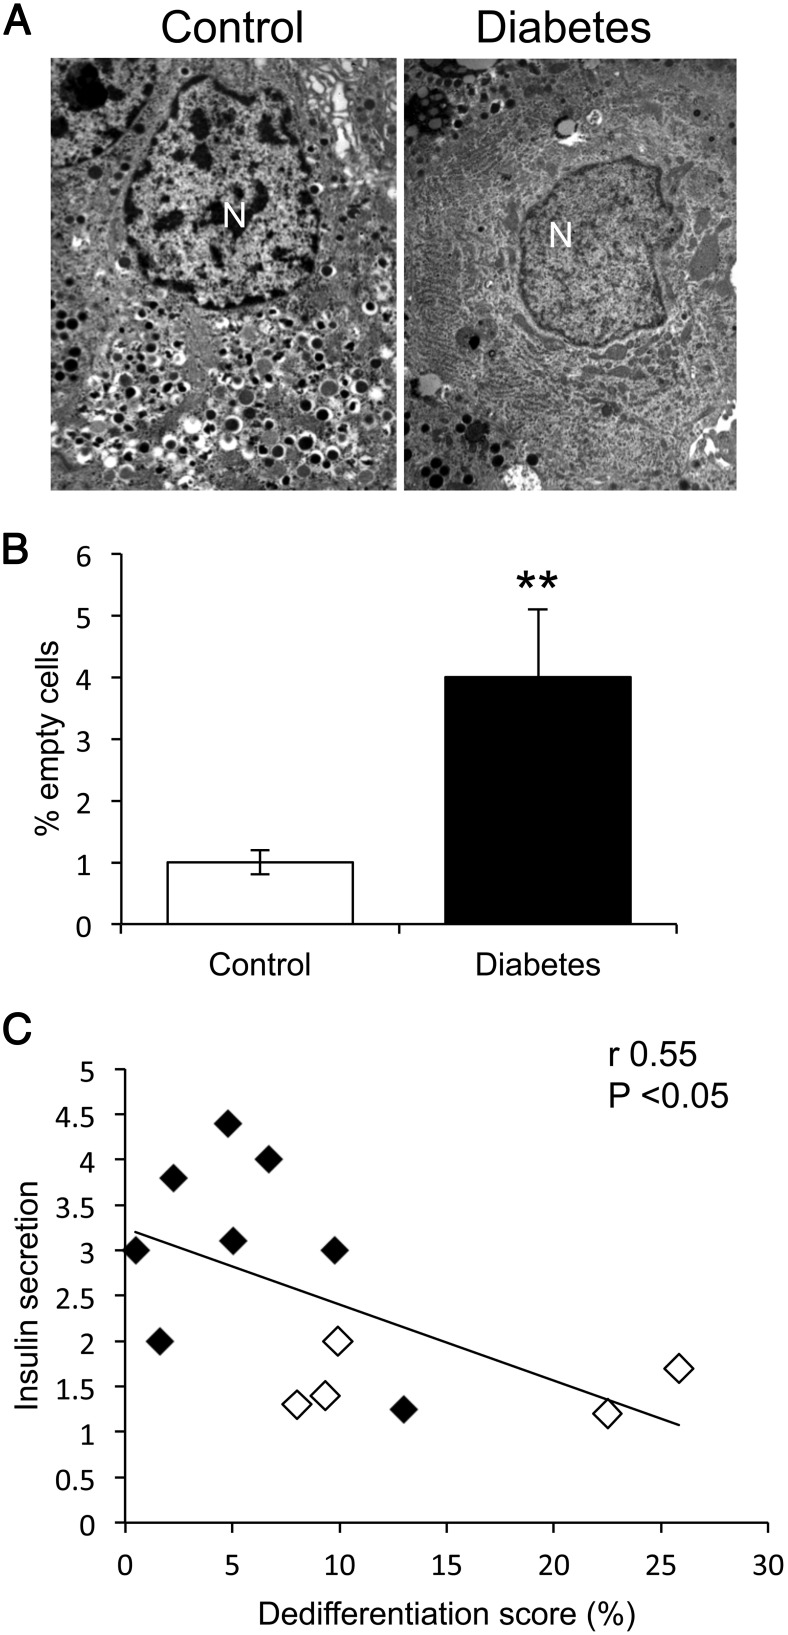
Figure 2.
EM and correlation of insulin secretion with dedifferentiation. A, Representative images of healthy and degranulated cells. B, Quantitative analysis of EM findings. Data are mean ± SEM. **, P < .01 by Student's t test. N, nucleus. C, We plotted linear correlation analyses (Spearman's r) between the dedifferentiation score, calculated as % ratio of SYN+4H−/SYN+ cells, and glucose-induced insulin secretion in isolated islets obtained from 13 donors. Controls are denoted by filled symbols, persons with diabetes by open circles.

