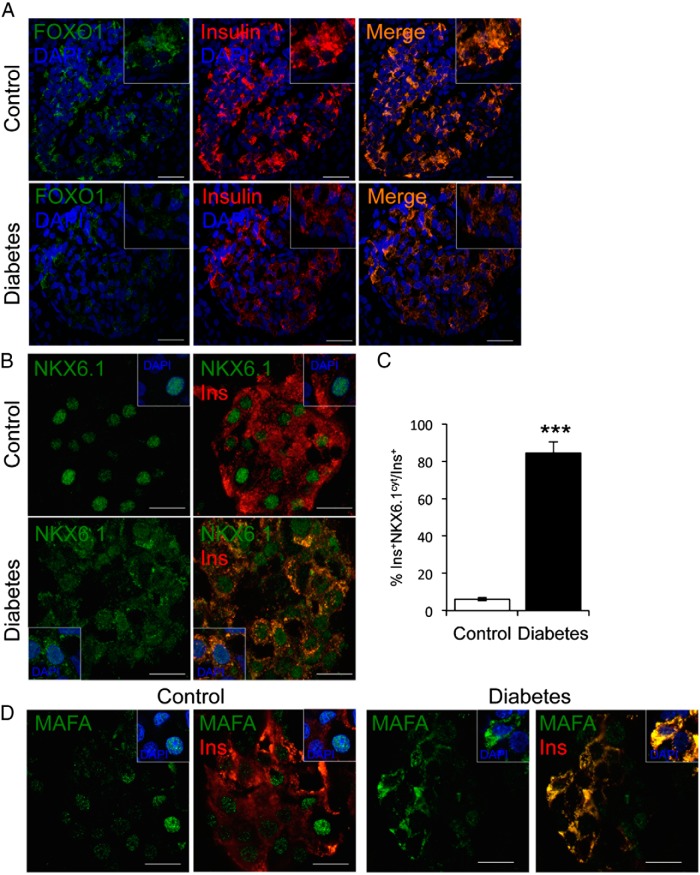
Figure 3.
Transcription factor analysis in pancreatic islets. A, Immunofluorescence on fresh-frozen pancreatic sections with FOXO1 (green), insulin (red), and DAPI (blue). B, Immunofluorescence with NKX6.1 (green), insulin (red), and DAPI (blue). C, Quantitative analysis of the data, shown as mean ± SEM. D, Immunofluorescence with MAFA (green), insulin (red), and DAPI (blue). Insets show representative cells. ***, P < .001 by Student's t test. Scale bars, 20 μm (A) and 10 μm (B and D); n = 5 for each group.

