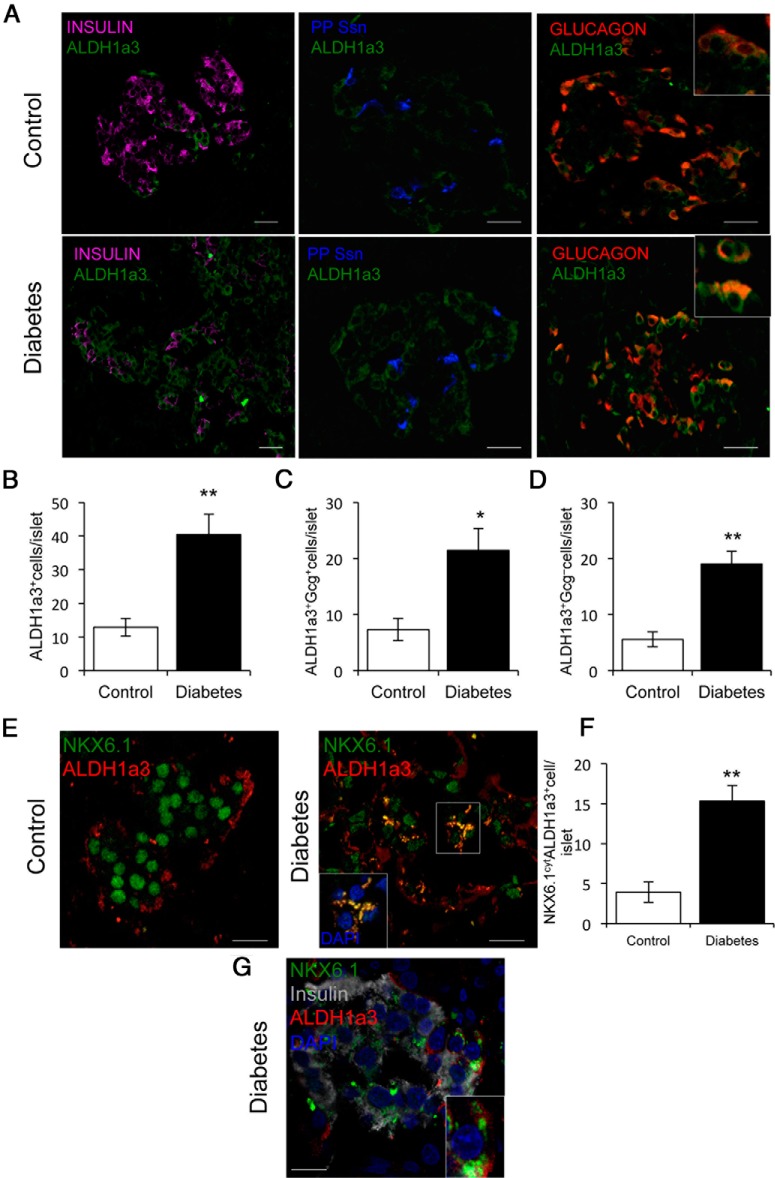
Figure 5.
ALDH1A3 localization in human islets. A, Immunofluorescence of ALDH1a3 (green) with insulin (magenta), combined Ssn and PP (blue), and Gcg (red). Scale bars, 20 μm. B–D, Quantitative analysis of the data shown as mean ± SEM. *, P = .05; **, P < .01 by Student's t test; n = 5 for each group. E, ALDH1A3 (red) colocalization with cytoplasmic NKX6.1 (green). Scale bars, 10 μm. F, Quantitative analysis of the data expressed as mean ± SEM. **, P < .01 by Student's t test; n = 5 for each group. G, Immunofluorescence of ALDH1a3 (red) with insulin (gray), NKX6.1 (green), and DAPI (blue). Inset shows ALDH1a3 colocalization with NKX6.1 in insulin negative cell. Scale bar, 10 μm.

