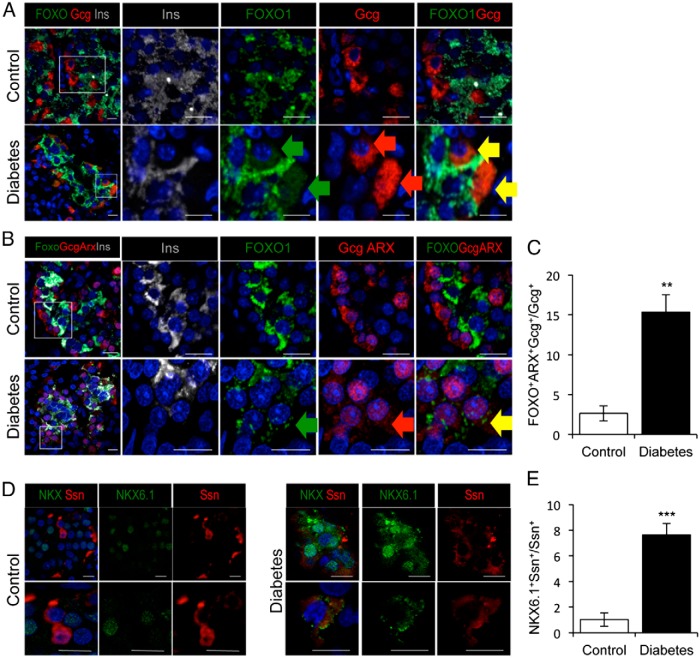
Figure 6.
Evidence of β-cell conversion to non-β-cells. A, Mislocalization of FOXO1 (green) to Gcg-immunoreactive cells (red). B, Mislocalization of FOXO1 (green) to ARX- and Gcg-immunoreactive cells (red). C, Quantitative analysis of triple positive (FOXO1, ARX, and Gcg) cells, as determined by the assay in C. D, Mislocalization of NKX6.1 (green) to Ssn-immunoreactive cells (red). E, Quantitative analysis of double positive (NKX6.1 and Ssn) cells. Insulin immunofluorescence is shown in gray (A and B). Scale bars, 10 μm (A, B, and D). In all panels, nuclei are counterstained with DAPI (blue). Green, red, and yellow arrows in panel indicate FOXO1+GCG+ cells (A) and FOXO1+GCG+Arx+ (B). C and E, Data as mean ± SEM. *, P = .05; **, P < .01; ***, P < .001 by Student's t test; n = 5 for each group.

