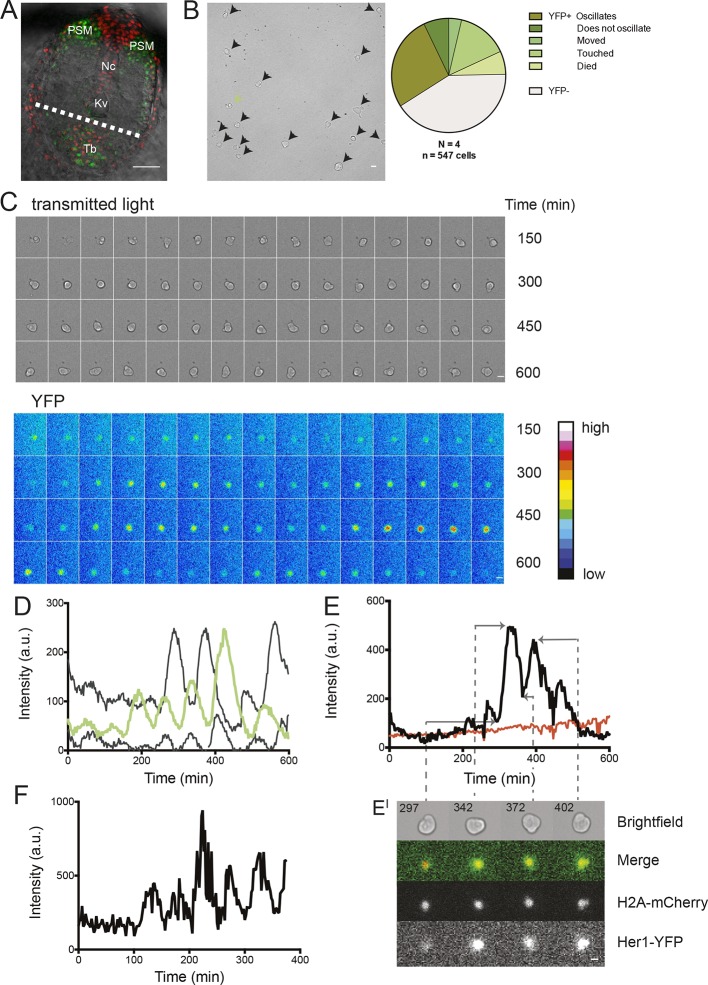
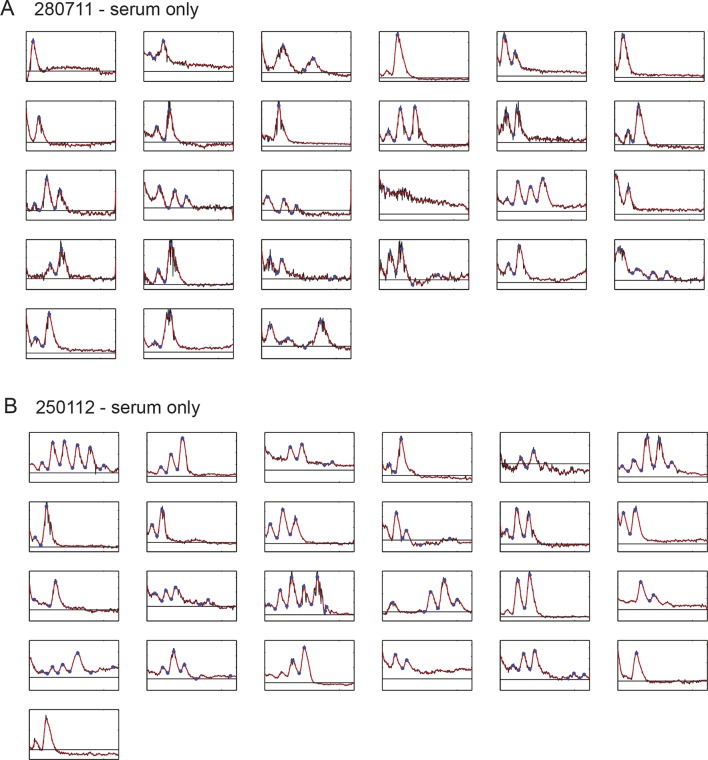
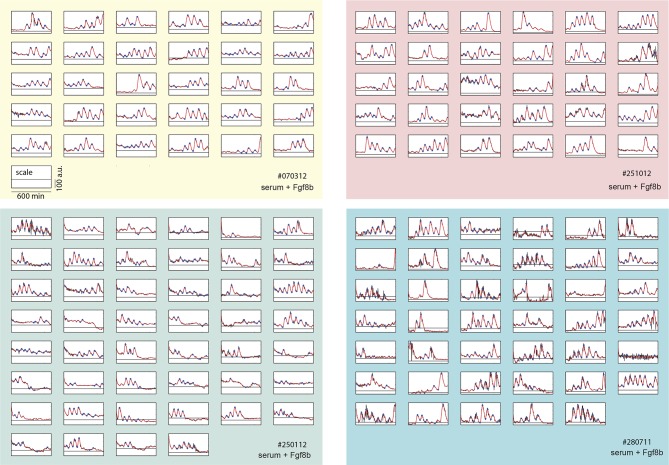
Figure 1. Zebrafish segmentation clock cells oscillate autonomously in culture.
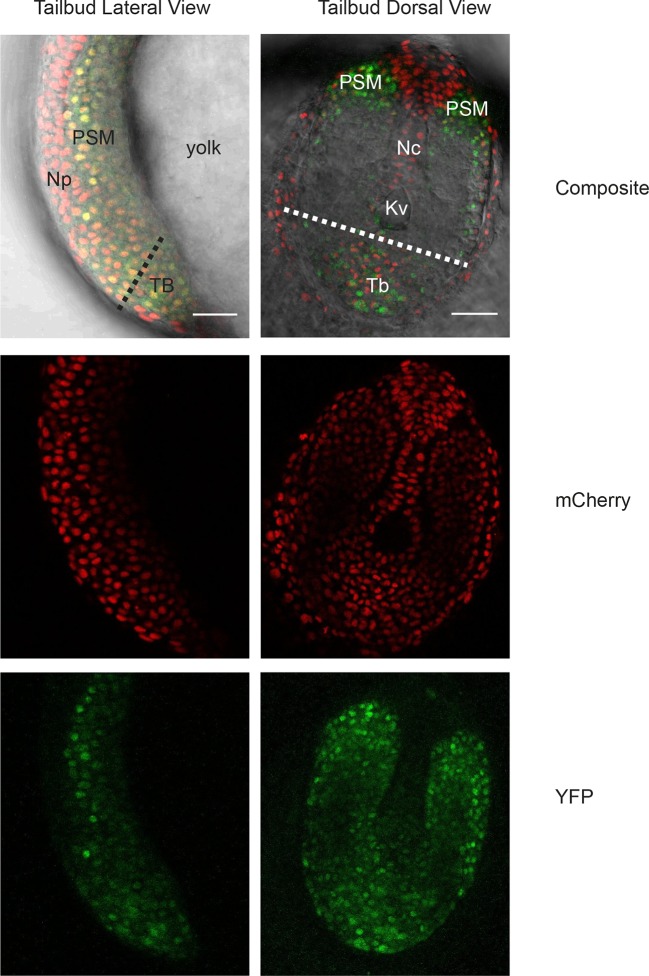
(A) Confocal section through the tailbud of a Looping zebrafish embryo in dorsal view where the dotted line indicates the anterior limit of tissue removed. Nuclei are shown in red and YFP expression in green. Scale bar = 50 μm. Kupffer’s vesicle (Kv), notochord (Nc), presomitic mesoderm (PSM), tailbud (Tb). (B) A representative 40x transmitted light field with dispersed low-density Looping tailbud-derived cells. Individual cells highlighted with black arrowheads; green arrowhead shows cell with green time series in (D). Scale bar = 10 μm. Pie chart: More than half of the in vitro population of Looping tailbud cells (n = 321 out of 547 cells combined from 4 independent culture replicates as described in Materials and methods) expresses the Her1-YFP reporter. Some expressing cells are disqualified because they move out of the field of view (4%), touch other cells by colliding in the field of view (12%) or following division (2%) for a total of 14%, or do not survive until the end of the 10-hr recording (7%). (C) Montage of timelapse images (transmitted light, top; YFP, bottom) of a single tailbud cell (green arrowhead in panel B) over 10-hr recording. Scale bar = 10 μm. (D) YFP signal intensity (arbitrary units) measured by tracking a regions of interest over 3 single tailbud cells (green trace follows cell marked by green arrowhead in B, gray traces are two additional cells from culture). Plotted in 2-min intervals. (E) Plot of Her1-YFP (black) and H2A-mCherry (red) signal intensity over time measured together from a representative cell. (EI). Nuclear YFP signal accumulates and degrades over time, as shown in the overlay of H2A-mcherry signal (red channel) and Her1-YFP signal (green channel) during troughs (297, 372) and peaks (342, 402) in Her1 expression. mCherry signal in the nucleus is relatively constant. Plotted in 2-min intervals. (F) Plot of YFP intensity (a.u.) over time in a fully isolated tailbud cell within a single well of a 96-well plate. Plotted in 2-min intervals.
DOI: http://dx.doi.org/10.7554/eLife.08438.003

