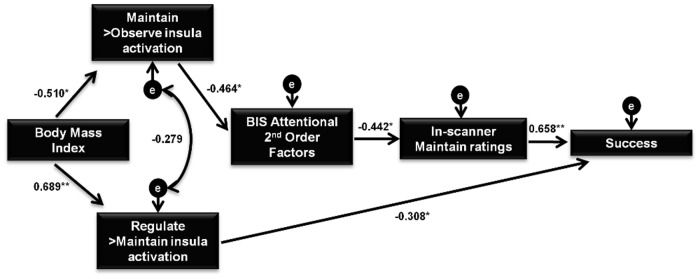
Fig 5. Final Path Analysis Model.
Model 3 was the best representation of the observed relationship between variables and examined the complex associations between Body Mass Index (BMI), neuroimaging results and behavioral data. BIS-11 = Barratt Impulsiveness Scale; Standardized regression weights for direct effects are shown *p<0.05 **p<0.001.

