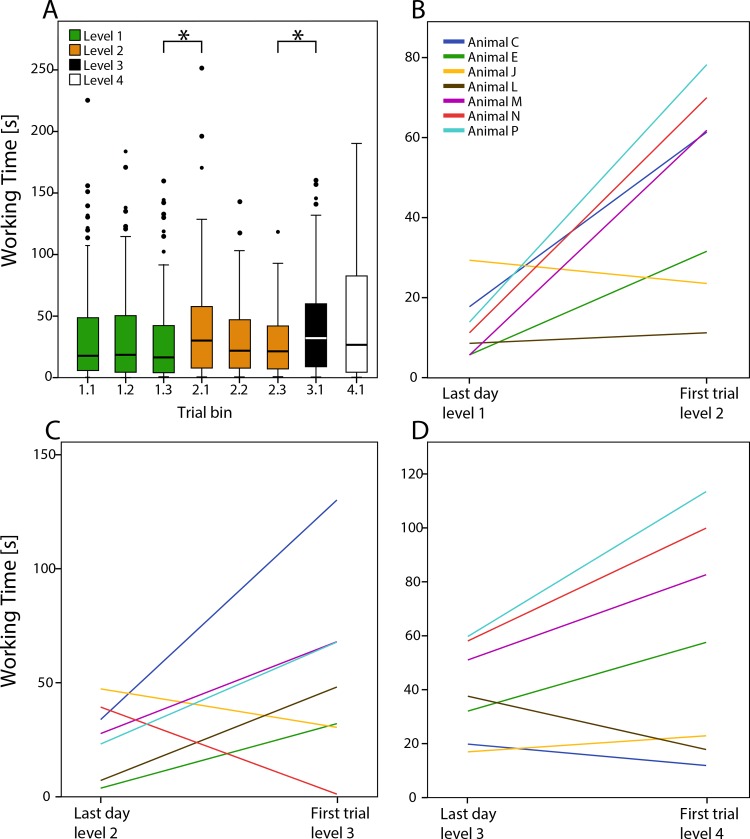
Fig 3.
Boxplot of working times over trial bins for grouped animals (A). Central line indicates median; boxes represent 2nd and 3rd quartiles and whiskers 1st and 4th. Dots denote outliers. Asterisks indicate significance (p < 0.05). Median working times (B-D) Median working times plotted for individual animals show performance during the last day of a level and the single first trial of the subsequent level.

