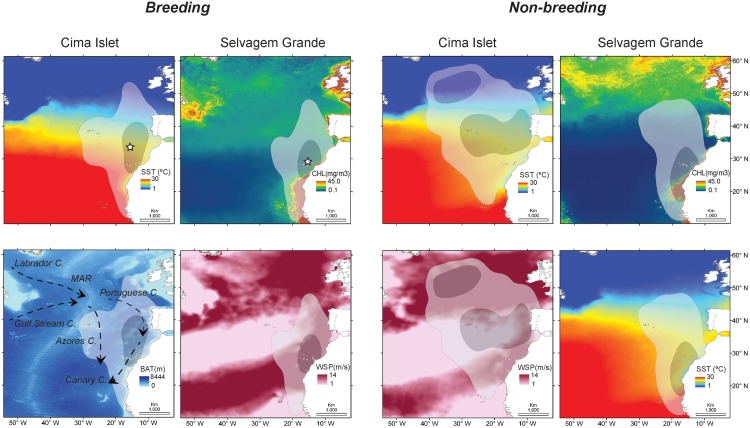
Fig 1. Breeding and non-breeding distribution of Macaronesian shearwater from Cima Islet and Selvagem Grande Island (white stars).
Darker inner area—Kernel UD 50 and lighter outer area—Kernel UD 95 overlaid on Sea Surface Temperature (SST), sea surface chlorophyll a concentration (CHL), sea bathymetry (BAT) and wind speed (WSP). Dynamic predictors are shown as averaged composites for all the breeding (December-May) and non-breeding (June-November) periods. Also shown in the BAT map are the main Currents (e.g. Canary C.) influencing the oceanography of the study area. Selection of environmental predictors to show as background was (mostly) based on the importance of those variables for the four habitat niche (MaxEnt) models.

