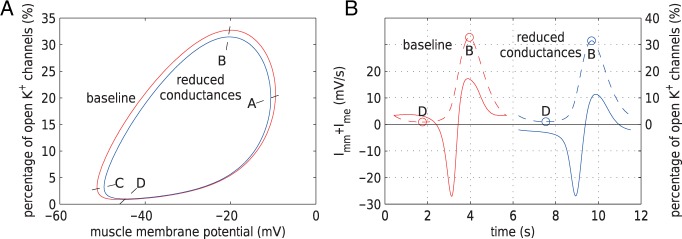
Fig. 11.
(A) Limit cycles of muscle potential and K channels opening of
afferent arteriole smooth muscle cells located
  upstream
of the TGF application site. Trajectories are counterclockwise for both
cycles. (B) Time courses of net gap-junctional current
 (solid lines) and fraction of open K
 channels (dashed
lines).

