Fig. 8.

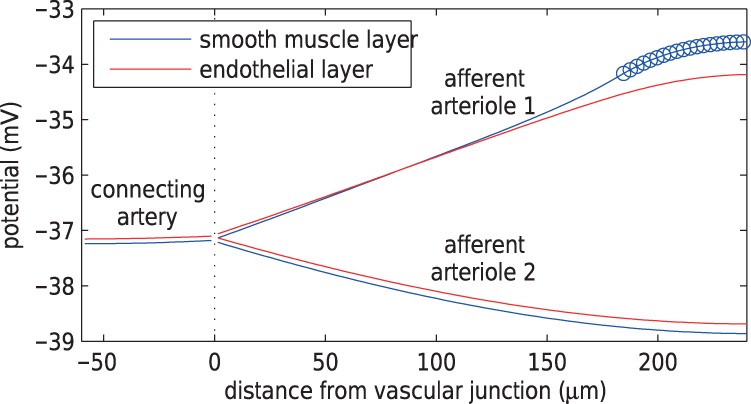
Time average smooth muscle and endothelium potential profiles under maximal stimulation of TGF at nephron 1. Circles denote the TGF application site. Length constant of depolarization is longer in endothelium than in smooth muscle.

Time average smooth muscle and endothelium potential profiles under maximal stimulation of TGF at nephron 1. Circles denote the TGF application site. Length constant of depolarization is longer in endothelium than in smooth muscle.