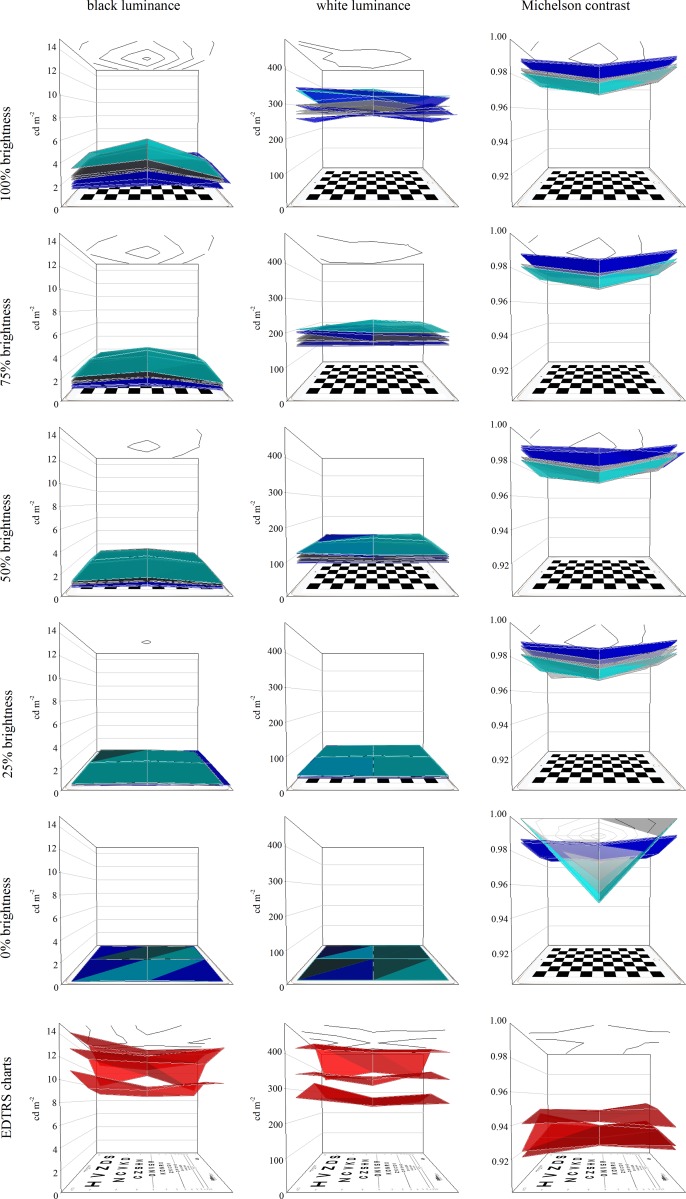
Fig 3. Luminance of black (left) and white (centre) squares, and of Michelson contrast (right) for the seven tablets at nominal maximum (“100%”, top) to minimum (“0%”, bottom) brightness settings.
Coloured surfaces in each plot also demonstrate luminance and contrast uniformity, by joining the nine measured values. Ceiling contour plots represent the mean uniformity profile of all seven tablets. Cyan surface: iPad 3 tablet. Grey surfaces: iPad 4 tablets. Blue surfaces: iPad Air 2 tablets. Data for the three EDTRS charts based on luminance of black optotypes and adjacent white backgrounds are shown in the lowermost plots (red surfaces).

