
FIGURE 1:
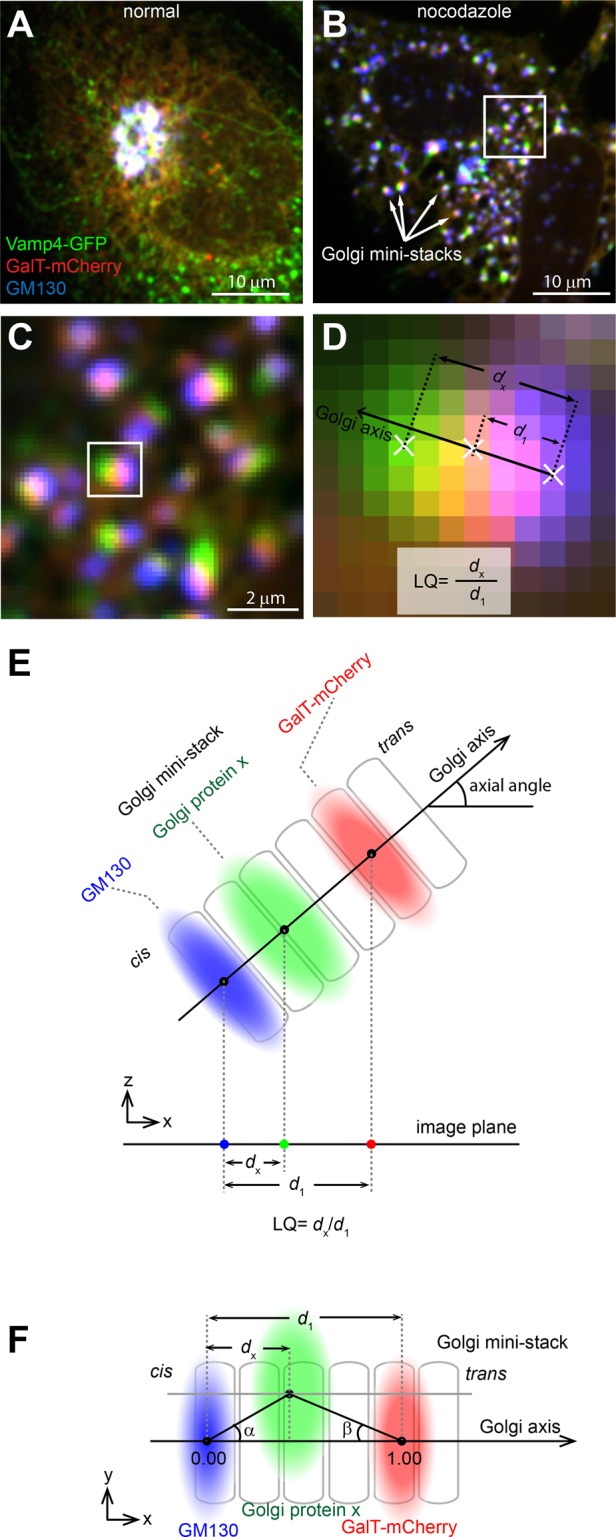
Overview of GLIM. HeLa cells transiently expressing Vamp4-GFP (green) and GalT-mCherry (red) were treated without (A) or with (B) nocodazole and processed for immunofluorescence labeling of endogenous GM130 (artificially colored as blue). Arrows indicate examples of Golgi ministacks. Scale bars, 10 μm. The boxed region in B is enlarged in C to show Golgi ministacks, which display visible separation of the three Golgi proteins. Scale bar, 2 μm. The boxed Golgi ministack is further enlarged in D to schematically illustrate centers of mass (denoted as white crosses) and the calculation of the LQ. (E) Schematic diagram illustrating the Golgi axis, axial angle, d1, dx, and the calculation of the LQ. During imaging, the Golgi ministack in 3D space is projected onto the image plane, and the diagram shows the xz-view. (F) Schematic diagram illustrating angle α, angle β, and the projected distance dx. The Golgi ministack image is in the xy-plane or the image plane and the center of the protein x is off-axis.