
FIGURE 3:
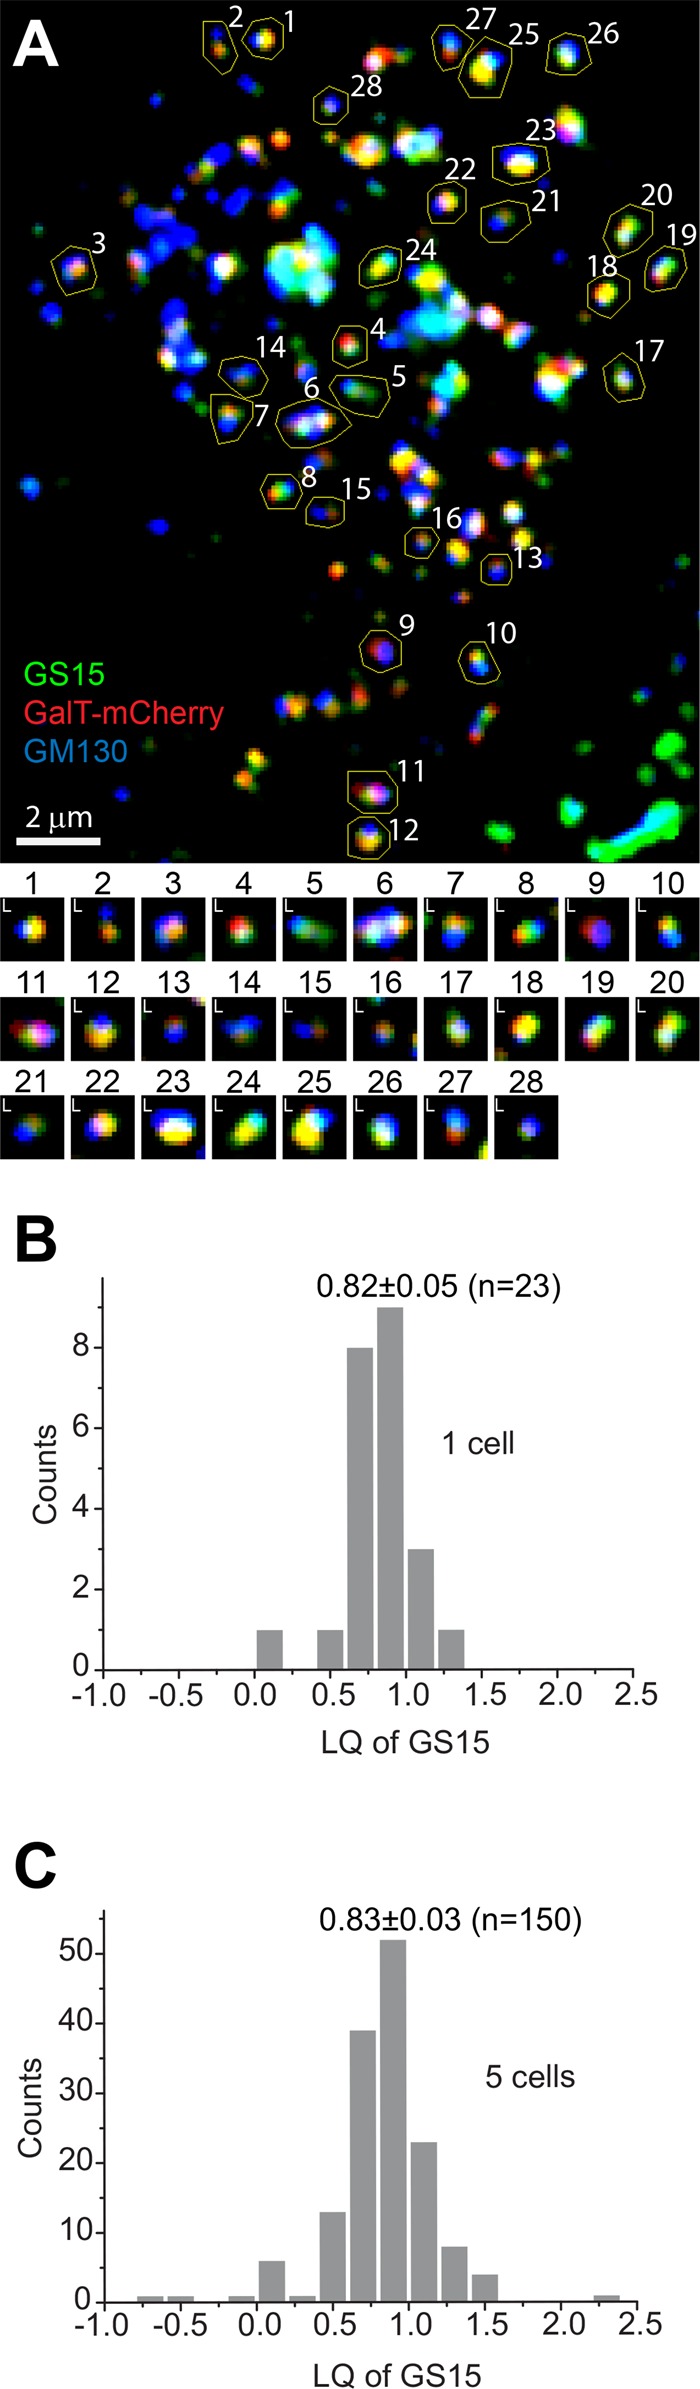
A typical example of GLIM, here acquiring the LQ of GS15. (A) Nocodazole-treated cells expressing GalT-mCherry (red) were stained for endogenous GM130 (blue) and GS15 (green). Golgi ministacks were selected by manually drawn ROIs and labeled by identification numbers. Images of these masked Golgi ministacks are shown below with their identification numbers. L, the Golgi mini-stack is valid for the calculation of the LQ (analyzable Golgi ministacks). Scale bar, 2 μm. (B) Histogram of LQs of 23 ministacks (denoted by L) from the cell in A. (C) Histogram of LQs of 150 ministacks from five cells. The value shown in each histogram is mean ± SEM.