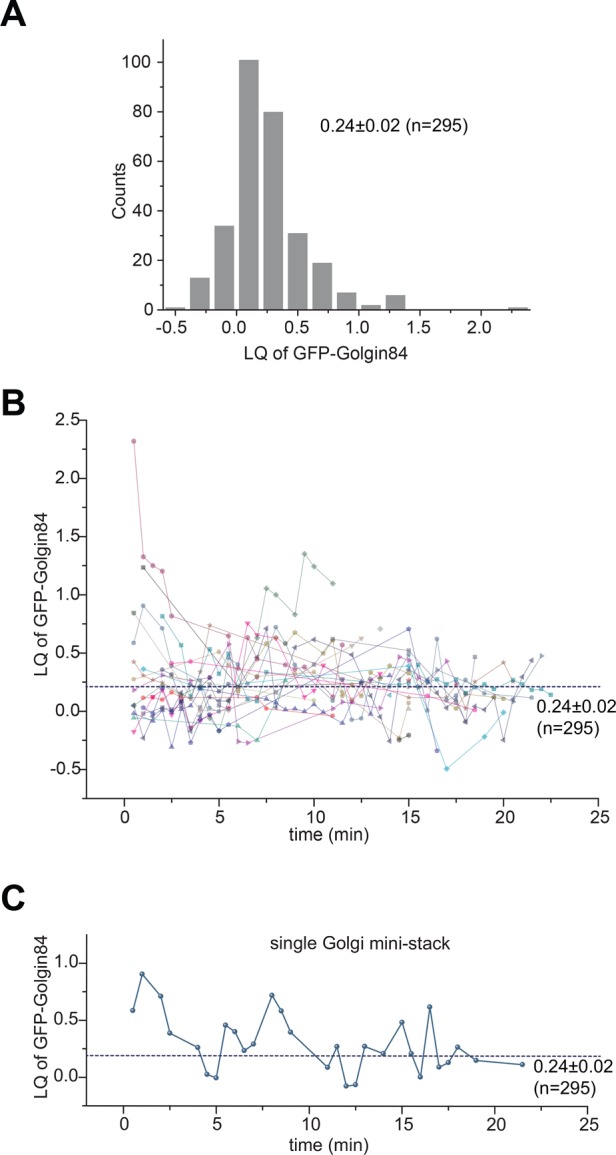
FIGURE 5:

The dynamic fluctuation of the LQ of Golgin84 during live-cell imaging. Cells transiently expressing GalT-iRFP670, GFP-Golgin84, and mCherry-GM130 were imaged live for 24 min with a time interval of 30 s (Supplemental Video S1). (A) Histogram of LQs of GFP-Golgin84. We plotted together 295 LQs from 29 Golgi ministacks at various time points. (B) The LQ of GFP-Golgin84 for each Golgi ministack, represented by different shapes and colors, plotted against time (minutes). Nearest available data points are connected by lines of the same color. Note that some Golgi ministacks have only single data points. (C) Typical LQ trace showing dynamic changes of the organization of the Golgi ministack. The dotted horizontal line indicates the population mean. The value indicated is mean ± SEM.
