
Figure 2.
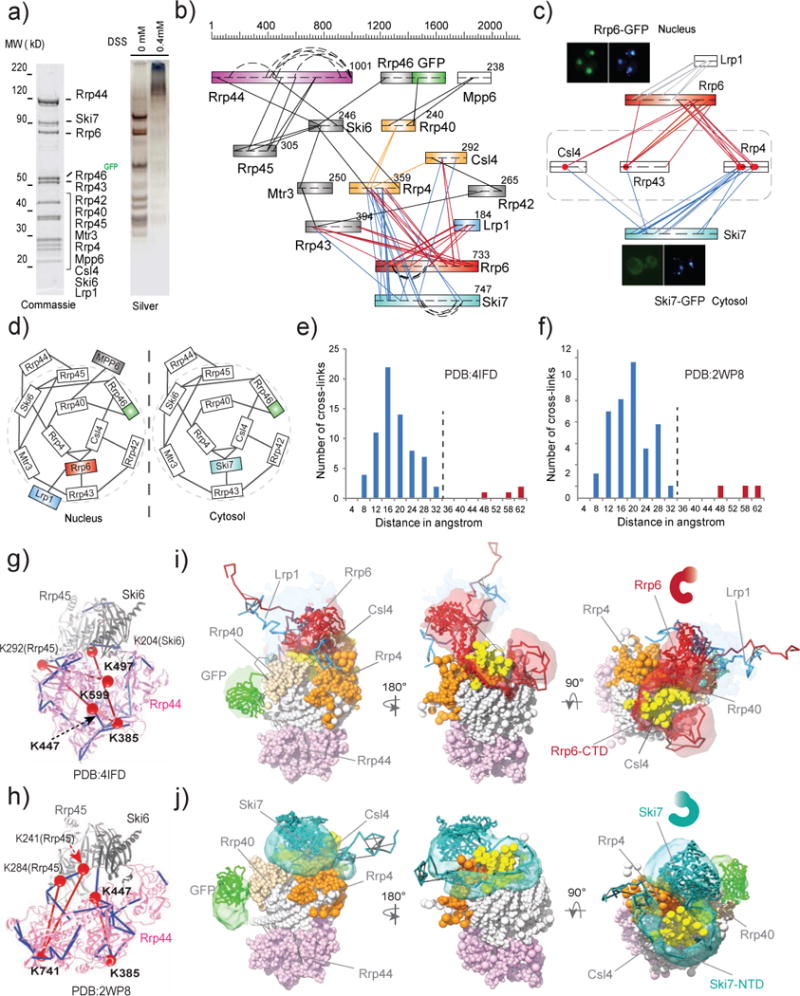
nCOGNAC CX-MS analysis and integrative structural modeling of the eukaryotic exosome complexes. a) SDS-PAGE analyses of affinity-captured and on-bead cross-linked exosome complexes. The protein components were identified by MS. Approximately 30 pmol (~15 μg) of this affinity captured material was used for each CX-MS analysis. b) Cross-link map for exosome complexes. Straight lines represent intersubunit cross-links, while curved lines represent distal intrasubunit cross-links. c) Heterogeneity of the exosome complexes revealed by CX-MS. Red dots represent lysine residues (on Rrp4, Rrp43, and Csl4) that are cross-linked to both Rrp6 and Ski7, indicating the presence of two different complexes in the affinity captured material. Subcellular localizations of Rrp6-GFP (nucleus) and Ski6-GFP (cytosol) were imaged by fluorescence microscopy. d) Cartoon models for the exosome complexes. e) Euclidean Cα-Cα distance distributions of all measured cross-links on the crystal structure of PDB# 4IFD. The Y-axis provides the number of cross-links that are mapped to the crystal structures. Blue bars represent DSS cross-links shorter than 30Å while red bars represent those longer than 44Å. f) Euclidean Cα-Cα distance distributions of all measured cross-links on the crystal structure PDB# 2WP8. g)–h) Observed cross-links displayed on the crystal structures of exosome complexes (PDBs #4IFD and 2WP8). Colors are coded as for e) and f). i)–j) Structural models of nuclear Rrp6-Lrp1-exo10 and cytosolic Ski7-exo10 exosome complexes. Localization density maps of the best 500 scoring models are shown.