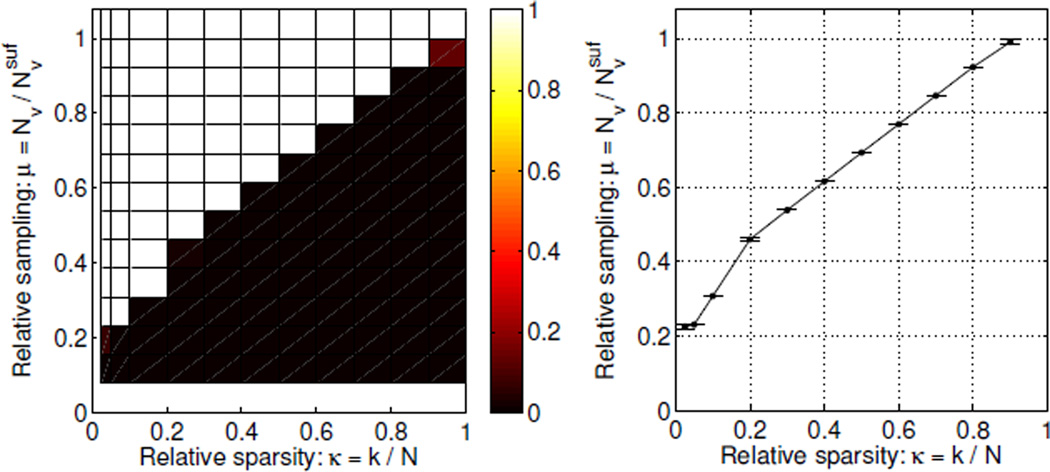
Figure 4.
Left: Phase diagram for spikes images (Nside = 64) showing fraction of image instances recovered by L1 as function of relative sparsity and relative sampling. Each square corresponds to the κ value at the left edge of the square and the μ value at the bottom edge. The color ranges from black (no images recovered) to white (all images recovered). Right: Average relative sampling for L1 recovery and its 99% confidence interval to better show the location and width of the transition from non-recovery to recovery.

