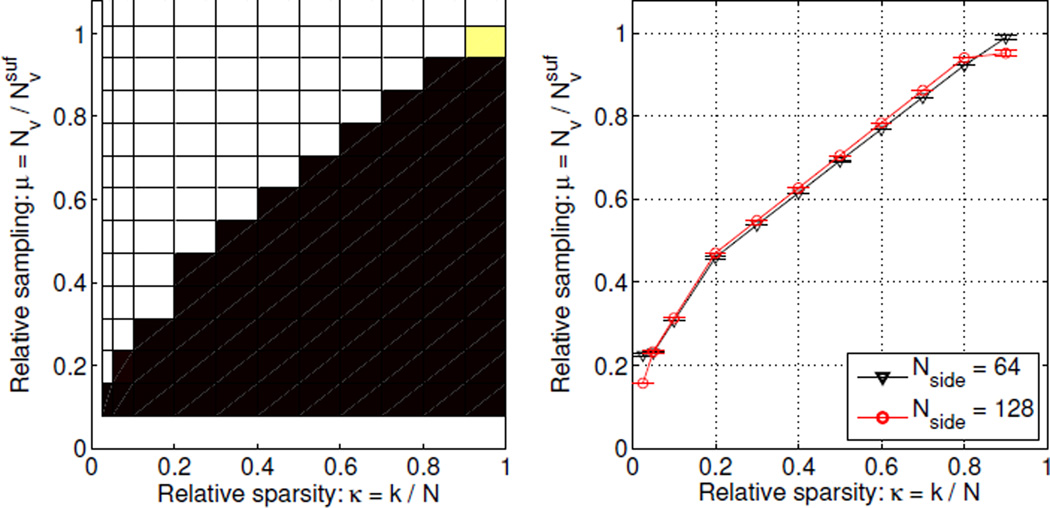
Figure 6.
Phase diagram dependence on image size for spikes images with Nside = 128, see caption of Fig. 4 for detailed explanation. Left: Phase diagram. Right: Average relative sampling for L1 recovery and 99% confidence intervals indicating that the transition is independent of image size.

