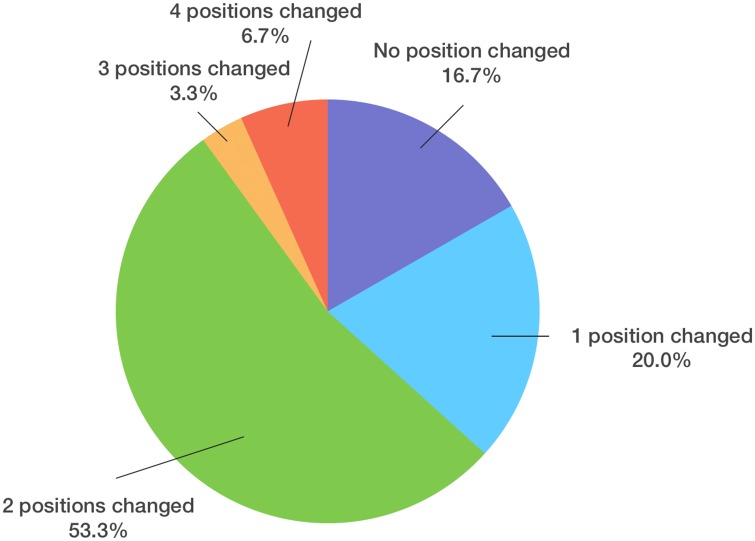
Fig 6. Pie chart of patients with different amounts of position changes.
According to the changes from Position1 (2D planning) to Position2 (3D simulation), 5 (16.7%) patients underwent no change, 6 (20.0%) had a change in one, 16 (53.3%) had a change in two, 1 (3.3%) had a change in three and 2 (6.7%) had a change in four parameters (Fig 4). 26 (83.3%) patients underwent the procedure with at least one modification of the initial 2D planning, while 16.7% had no changes from the 2D plan.

