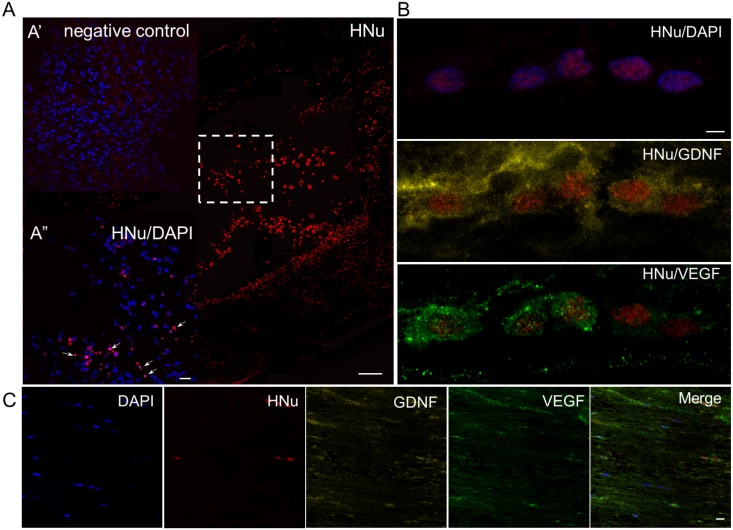
Fig 4. Visualization of grafted cells at day 30 after transplantation.
Visualization of grafted cells in the SCI zone 30 days after transplantation of UCB-MCs+Ad5-EGFP (A) and UCB-MCs+Ad5-VEGF+Ad5-GDNF (B). Localization of transplanted UCB-MCs+Ad5-VEGF+Ad5-GDNF after Sham operation (C). (A) HNu+ cells (red) surviving in the spinal cord contusion area, and forming cell bridges within the traumatic centromedullary cavity. The dashed boxes indicate enlarged area of A”. Arrows show some the HNu and DAPI overlap cells which were used for analysis. (A’) The same area, labeled by dashed boxes, in subsequent serial sections was stained as negative control. (B) In UCB-MCs+Ad5-VEGF+Ad5-GDNF-treated rats the contusion area with spared tissue contained mostly HNu+ cells, which expressed VEGF and GDNF. (C) HNu+/VEGF+/GDNF+ cells arranged accordingly to the nerve fibers 30 days after Sham with injection of UCB-MCs+Ad5-VEGF+Ad5-GDNF. Nuclei are stained with DAPI (blue). Scale bar: 200 (A), 10 (A’, A”), 2,5 (B) and 20 (C) μm.

