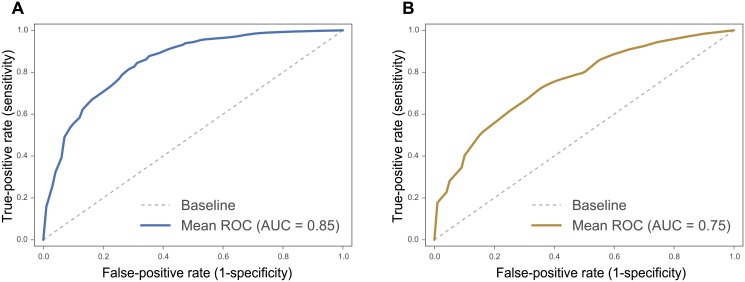
Fig 4. The classification performance.
Mean ROC curves demonstrating the model performance in predicting ties type. Panel (A) shows the prediction performance for reciprocal ties (AUC = 0.85, 95% CI: 0.82–0.87). Panel (B) shows the model performance in prediction incoming ties (AUC = 0.75, 95% CI: 0.70–0.80).

