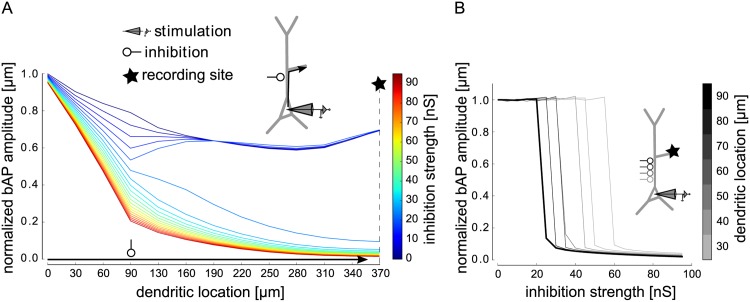
Fig 2. Analysis of the effect of inhibition on the backpropagating action potential (bAP) in dependence on inhibitory conductance and dendritic location.
The bAP was triggered by threshold somatic current injection (as in Fig 1C). A: Amplitude of the bAP on its path from the soma, along the proximal apical dendrite into the distal oblique dendrite (arrow), normalized to its amplitude at the soma, for different values of inhibition strength (lines in different colors). Inhibition with a double exponential time course (τrise = 0.5 ms, τdecay = 5 ms) was placed on the proximal apical dendrite (90 μm from the soma). Inhibition onset was 2 ms after stimulation onset. The somatic spike peaked around 2.5 ms after stimulation onset. B: Amplitude of the inhibited bAP relative to the non-inhibited bAP as a function of inhibition strength, measured in the distal part of the oblique dendrite (indicated by star in illustration and in A) for different locations of inhibition on the apical trunk (different shades indicate distance to soma in μm, thick line for 90 μm). Inhibition had an all-or-none effect on the bAP.

