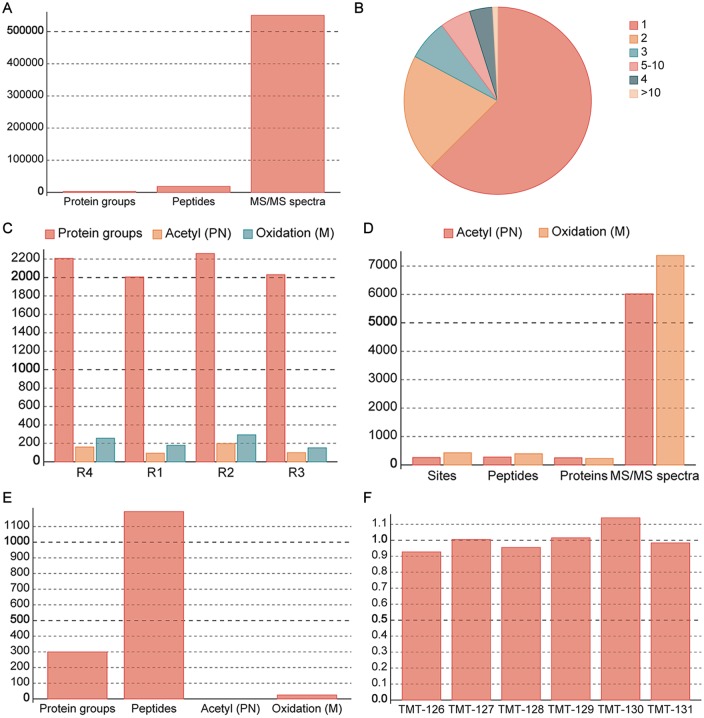
Fig 2. Examples of statistical charts.
MaxReport automatically generates various statistical charts for both identification and quantification results including: summary of proteome identification (A); distribution of site counts (B); summary of experiment specific identification (C), PN stands for protein N-terminal. M stands for Methionine residue. R represents different experimental replication; summary of PTM specific identification (D); summary of quantification results (E) and overall calibration factors (F).

