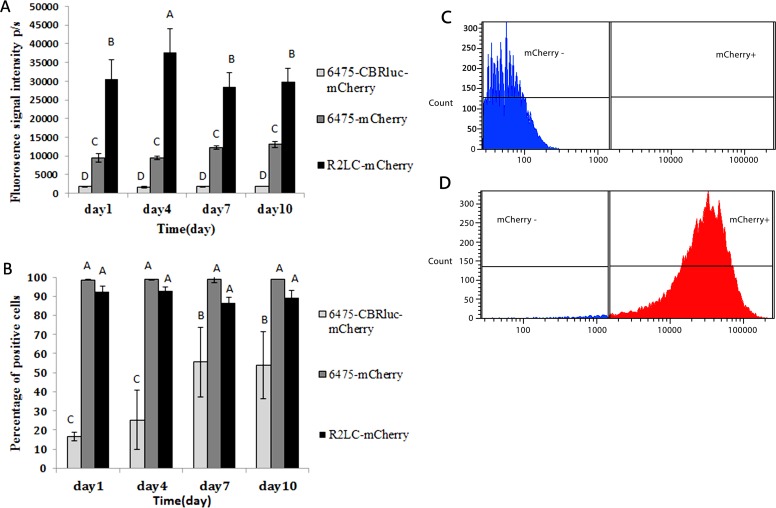
Fig 2. Flow cytometry analysis of mCherry-producing bacteria in the presence of selection pressure (erythromycin).
(A) Percentage of fluorescent bacteria. (B) Fluorescence signal intensity of mCherry-expressing bacteria. (C) Flow cytometry population count histograms for 6475 wild type and (D) 6475-mCherry. mCherry—shown in blue and mCherry + in red. A fraction of plasmid-bearing cells from days 1, 4, 7, and 10 of the 10-day serial subculture in the presence of selection pressure were selected for monitoring signal intensity by FCM. For each recombinant strain sample, PBS and wildtype strain were used as control for initial SSC-FSC gates to measure background fluorescence. The error bars indicate the standard deviation values. Different letters above the columns indicate significant differences (p≤0.05).

