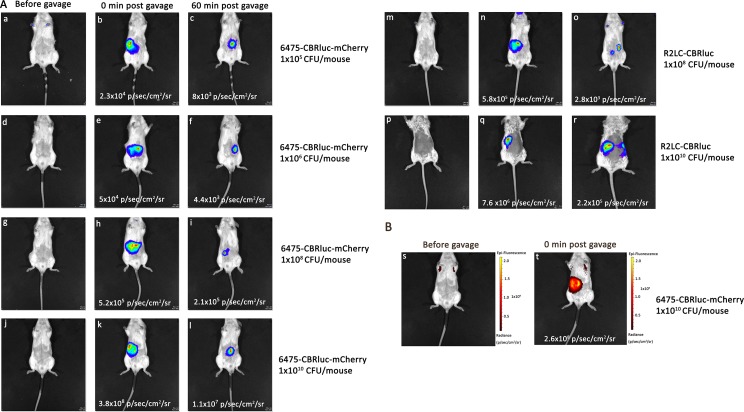
Fig 8. In vivo biophotonic imaging of 6475-CBRluc-mCherry and R2LC-CBRluc given at different doses.
In 3 separate experiments for luminescence and fluorescent imaging, BALB/c male mice were gavaged with fluorescent and luminescent strains: 6475-CBRluc-mCherry (n = 10), R2LC-CBRluc (n = 3) for luminescence and 6475-CBRluc-mCherry (n = 5) for fluorescence imaging. The signal intensities were compared 0 and 60 min after an intra-gastric inoculation. (A) Bioluminescence imaging of: (a, b, c) 6475-CBRluc-mCherry, 1x10⁵ CFU/mouse; (d, e, f) 6475-CBRluc-mCherry, 1x10⁶ CFU/mouse; (g, h, i) 6475-CBRluc-mCherry, 1x10⁸ CFU/mouse; (j, k, l) 6475-CBRluc-mCherry, 1x10¹⁰ CFU/mouse; (m, n, o) R2LC-CBRluc, 1x10⁸ CFU/mouse; (p, q, r) R2LC-CBRluc, 1x10¹⁰ CFU/mouse. (B) In vivo fluorescence imaging of: (s, t) 6475-CBRluc-mCherry, 1x10¹⁰ CFU/mouse before and immediately post gavage.

