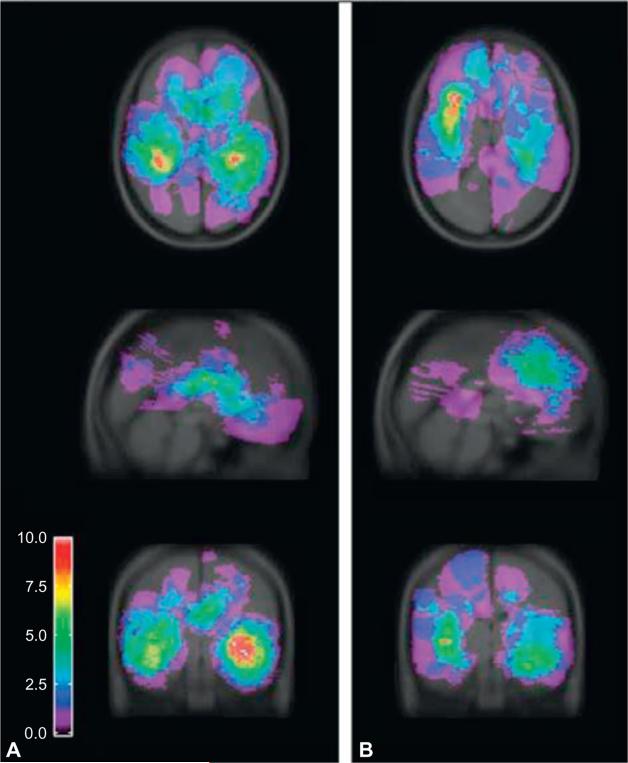
Fig. 16.1.
Summed statistic image demonstrating aggregate location of 124 tumors. At each voxel, the number of patients presenting with tumors is calculated. Maps are generated from the sum of the binary tumor masks for high-grade (A) and low-grade (B) gliomas. (Reproduced with permission from Lee et al., 2010, © American Medical Association. All rights reserved.)

