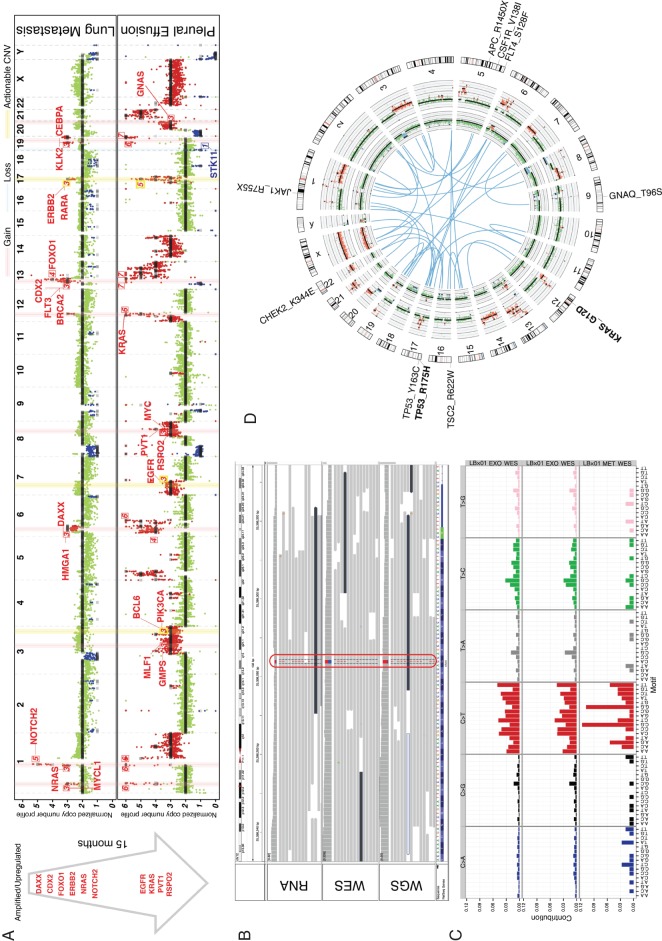
Figure 1.
LBx01 tumor profiling. (A) Copy number profile comparison between the metastatic lung tissue (top) sampled 15 months before the pleural effusion exoDNA (bottom). The cancer-related genes on the light-red vertical bars have copy number gains and those on the light-blue vertical bars have copy number losses, where the numbered labels represent the estimated copy numbers. The yellow vertical bar annotates putatively actionable copy number variations (CNVs) (e.g. ERBB2). The arrow to the left depicts the progression of cancer-associated CNVs between the 2 time points. These happen to all be amplifications, which were also confirmed to be upregulated in the exoRNA compared with that in the metastatic lung tissue RNA-seq. (B) Mutant KRAS was identified in the mRNA (RNA sequencing) as well as DNA (exome and genome sequencing) of the pleural effusion exosomes. (C) Mutational signature of the plasma exosomes derived from exome sequencing (top) and genome sequencing (middle) compared with the mutational signature of the metastatic lung tissue (bottom). (D) Circos plot illustrating putative gene fusions (blue), lung metastatic copy number profile (inner-most ring), pleural effusion exosomes copy number profile (second inner-most ring) and gene aberrations. Mutations seen in the pleural effusion are black and those seen in both the metastatic lung tissue and pleural effusion are in bolded black.

