
Figure 3.
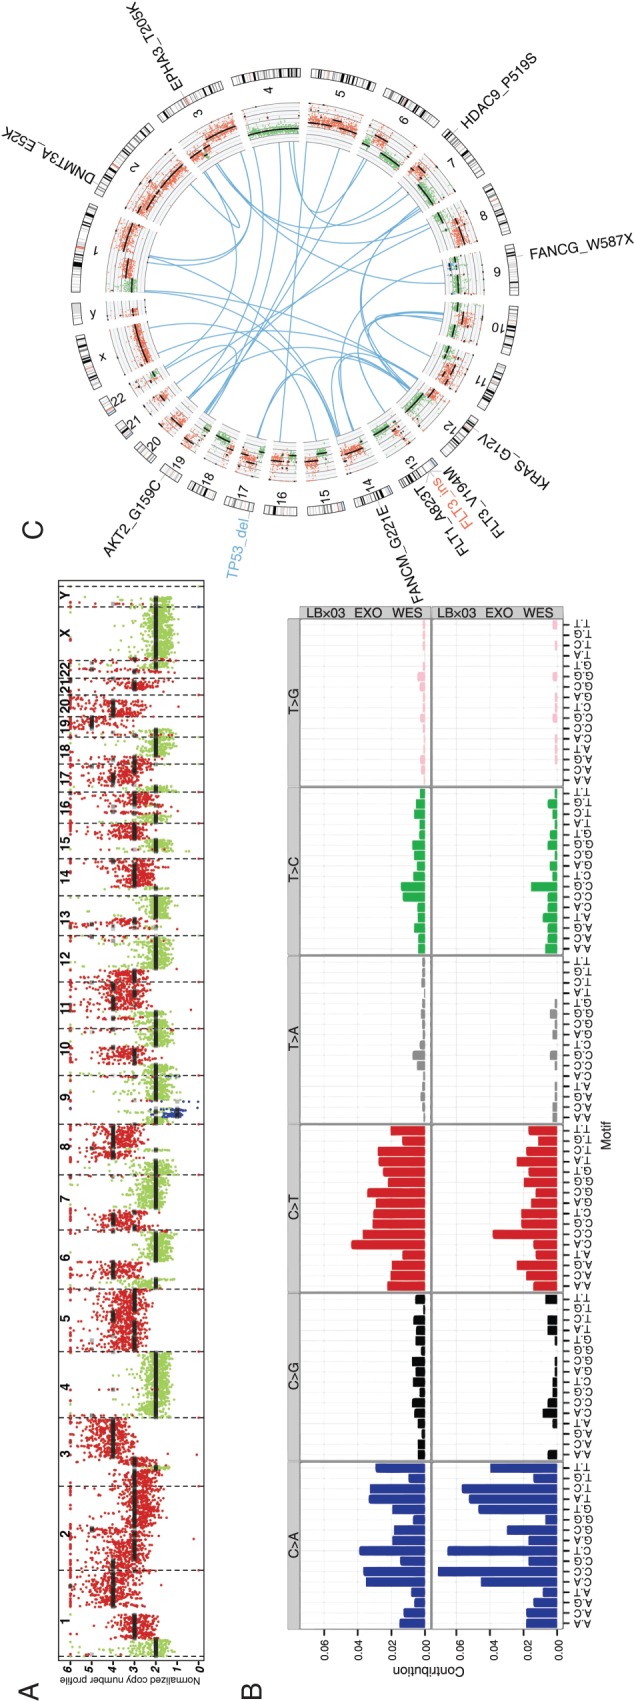
LBx03 tumor profiling. (A) Copy number profile of the plasma exoDNA. (B) Mutational signature of the plasma exosomes derived from exome sequencing (top) and genome sequencing (bottom). (C) Circos plot illustrating putative gene fusions (blue), plasma exoDNA copy number profile (inner-most ring) and potential actionable genes.