
Fig. 3. Initial on-fault stress conditions.
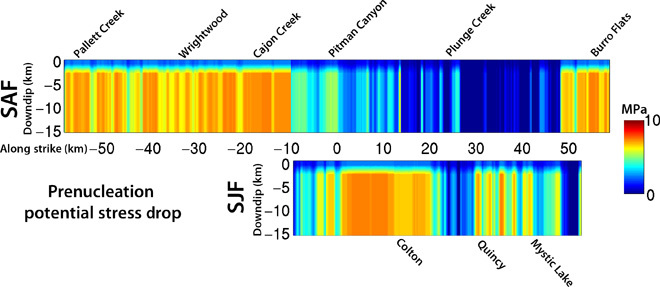
Warmer colors indicate regions of higher potential stress drop, which promotes more energetic rupture. The sharp contrast at −10 km along strike on the SAF represents a change in regional stress orientation (30). The other along-strike changes correspond to changes in fault strike. Potential stress drop tapers to zero over the top 3 km of the faults to account for reduced normal stress toward the free surface.