
Fig. 4. Model slip distributions.
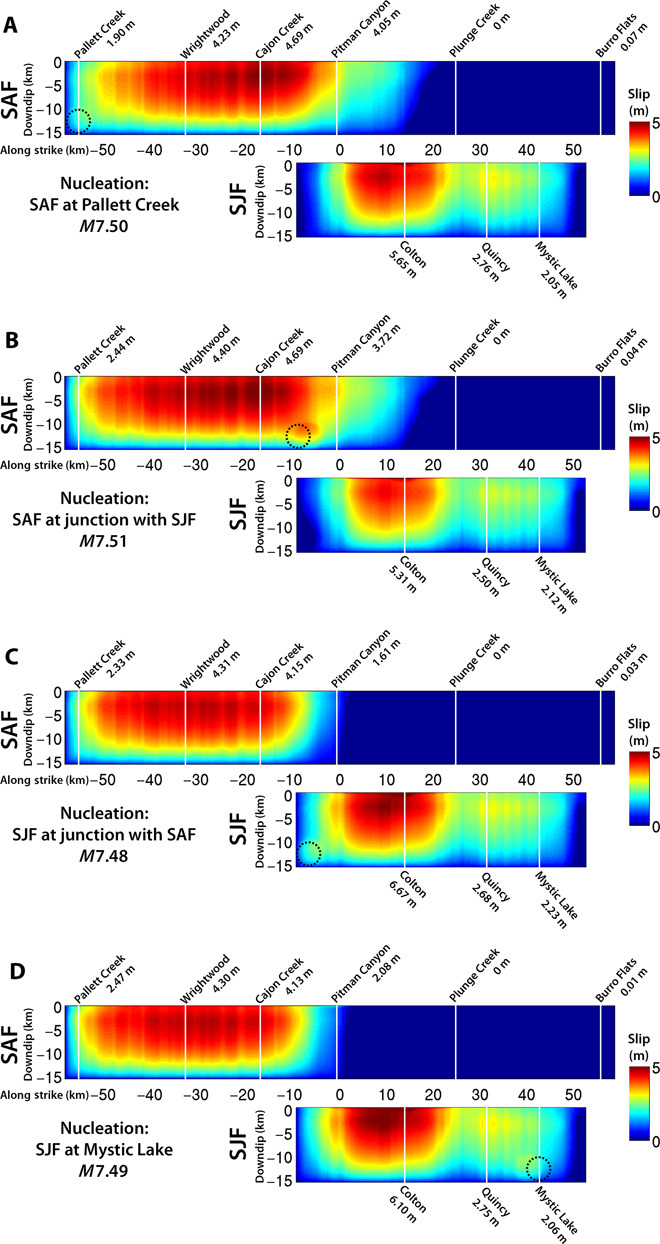
(A to D) Plots of total slip on the SAF and SJF for model ruptures with nucleation on the SAF at Pallett Creek (A), the SAF in Cajon Pass (B), the SJF in Cajon Pass (C), and the SJF at Mystic Lake (D). Paleoseismic sites are marked with white lines and listed with their surface slip value. The location of initial forced nucleation is indicated with the dashed black circle.