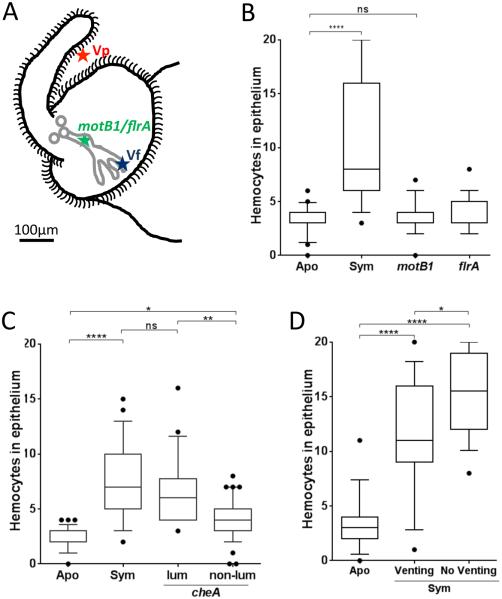
Fig. 3.
Bacterial delivery of the hemocyte-trafficking signal. The extent of hemocyte trafficking was determined by counting hemocytes in the sinuses of the anterior appendage of one epithelial field per light organ. (A) Diagram of the left side of a juvenile light organ showing both the surface in contact with the seawater (black outline) and the internal structures (pores, ducts, antechamber and deep crypts) through which symbionts migrate (gray). Indicated are the limits of migration of V. parahaemolyticus (Vp), which like other non-symbionts doesn’t enter the three pores; V. fischeri wild type (Vf), which migrates to and grows in the deep crypts; and, motility mutants (flrA; motB1), which cannot pass beyond the organ’s antechamber. The localization of the cheA mutant, which has been found to stochastically enter the pore (Mandel et al. 2012), is complex and has not been indicated here. When added to the surrounding seawater small particles, like OMVs, can diffuse into the crypts. See text for a full explanation. (B) Juvenile squid were exposed to motB1 and flrA mutants unable to complete the migration into the crypts. (C) Juvenile squid were exposed to 104 cfu of a V. fischeri cheA mutant per mL. After 18 h, animals were sorted into two groups: detectably luminescent (Lum) or not (Non-lum); in the former group, the cheA cells were presumed to have reached a crypt and proliferated, while in the latter, the cheA cells were presumed to have been unable to establish a sustained colonization. n=60. One-way ANOVA analysis (F=31; p<0.0001). (D) After inoculation, animals were either kept 12 h in the dark, followed by 4 h in the light to induce venting through the ducts and pores (Venting), or kept 16 h in the dark (No Venting) before the level of hemocyte trafficking was determined. One-way ANOVA analysis (F=37; p<0.0001).

