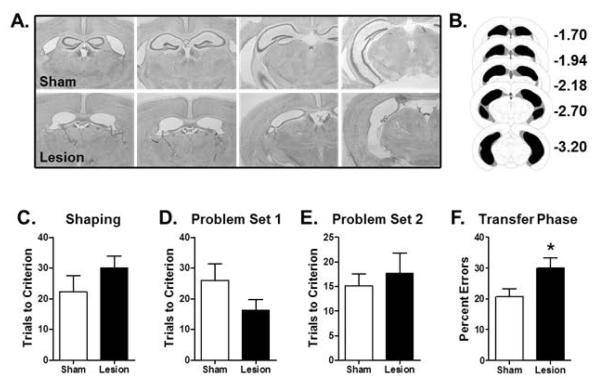
Figure 1. Effects of hippocampal lesions on transfer learning.
(A) Photomicrographs of Nissl-stained sections through the hippocampus of a representative sham (top) and lesioned (bottom) mouse. (B) Schematic shows the minimum (black) and maximum (gray) extent of the hippocampal lesions across all mice. (C) Bar graph shows mean number of trials (+SEM) required to reach criterion performance on the shaping problem prior to testing in the transfer learning task. (D) Bar graph shows mean number of trials (+SEM) to reach criterion on Problem Set 1 of the learning phase of the transfer task. (E) Bar graph shows mean number of trials (+SEM) to reach criterion on Problem Set 2 of the learning phase of the transfer task. (F) Bar graph shows mean percentage of incorrect choices (errors +SEM) on the transfer phase of the task. Lesioned mice made significantly more errors than sham control mice. See text for statistical analysis. * p < 0.05 compared to sham group.

