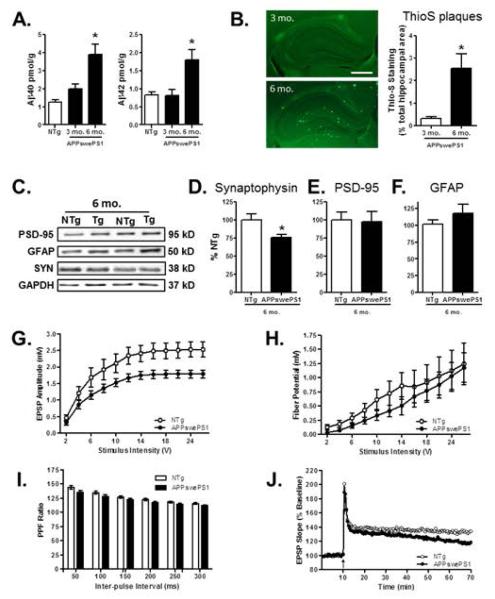
Figure 3. Amyloid and synaptic measures in the hippocampus of APPswe PS1 and NTg control mice.
(A) Bar graphs show mean (+SEM) levels of Aβ40 and Aβ42 peptides in the hippocampus of 6 mo. NTg control and 3 and 6 mo. APPswePS1 mice. Both Aβ40 and Aβ42 were significantly increased in 6 mo. APPswePS1 mice compared to 3 mo. APPswePS1 and NTg mice. (B) Photomicrographs showing thioflavin-S staining for amyloid plaques (bright green puncta) in the hippocampus of representative 3 and 6 mo. APPswePS1 mice. Scale bar = 500 μm. Plaque area (Thio-S staining as a percentage of total hippocampal area) was significantly greater in 6 than 3 mo. APPswePS1 mice. (C) Representative immunoreactive bands detected in hippocampal homogenates prepared from 6 mo. NTg and APPswePS1 (Tg) mice following incubation with antibodies to synaptophysin, PSD-95, GFAP, and the loading control GAPDH. (D-F) Bar graphs show mean (+SEM) hippocampal expression of each protein, expressed as a percentage of NTg mice processed on the same gel. Synaptophysin expression (D) was significantly reduced in APPswePS1 compared to NTg mice. In contrast, neither PSD-95 (E) nor GFAP (F) expression differed between APPswePS1 and NTg mice. (G) Line graph shows mean fEPSP (±SEM) amplitude at CA3-CA1 synapses in 6 mo. NTg and APPswePS1 mice, plotted as a function of stimulus intensity. The fEPSP amplitude was significantly reduced in APPswePS1 compared to NTg mice. (H) Line graph shows mean fiber potential amplitude (±SEM) at CA3-CA1 synapses in NTg and APPswePS1 mice, plotted as a function of stimulus intensity. (I) Bar graph shows mean paired-pulse facilitation ratio (+SEM) at CA3-CA1 synapses in NTg and APPswePS1 mice, plotted as a function of inter-pulse interval. (J) Line graph shows the slope of fEPSPs in response to test pulses before and after tetanus (arrow) at CA3-CA1 synapses in NTg and APPswePS1 mice, expressed as a percentage of pre-tetanus baseline. The rate of decay was significantly greater in APPswePS1 compared to NTg mice. See text for statistical analyses. * p < 0.05 compared to NTg and/or 3 mo. group.

