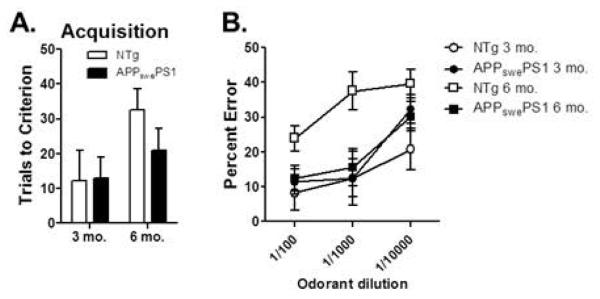
Figure 5. Odor detection threshold in APPswePS1 and NTg mice.
(A) Bar graph shows mean number of trials (+SEM) required to reach criterion performance on a novel odor discrimination problem (full strength). (B) Line graph shows mean (±SEM) percentage of errors on the same odor discrimination problem as in (A) but with serial dilutions of the target odorant. Although 6 mo. mice as a group performed worse than 3 mo. mice, this effect was driven by worse performance in NTg compared to APPswePS1 mice at this age.

