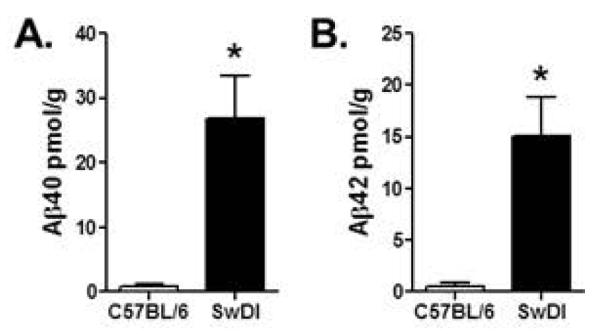
Figure 6. Amyloid measures in the hippocampus of Tg-SwDI and C57BL/6 control mice.

Bar graphs show mean (+SEM) levels of Aβ40 (A) and Aβ42 (B) peptides in the hippocampus of 6 mo. C57BL/6 and Tg-SwDI mice. Expression of both Aβ40 and Aβ42 were significantly greater in Tg-SwDI mice compared to C57BL/6 mice.
