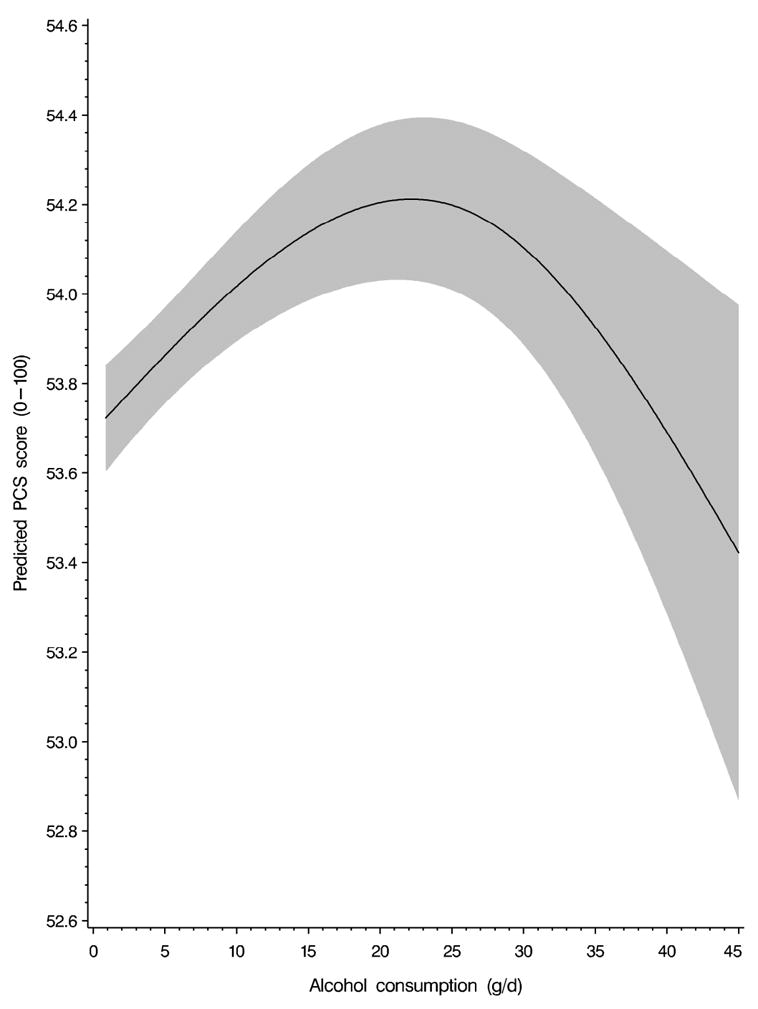
Fig. 1.

Non-linear dose–response relationship between alcohol consumption and subsequent physical component summary (PCS) scores. Data are derived from a restricted cubic spline generalized estimating equation model (lifestyle-adjusted model) in alcohol consumers. The model is adjusted for previous PCS score, age, physical activity, energy intake, body mass index, smoking, marital status, employment status, night shift work, race, region, living arrangement, and parity. Alcohol consumption is winsorized at the 99.5th percentile. The 95% confidence interval is indicated by the gray area. P < 0.001, test for non-linear relationship.
