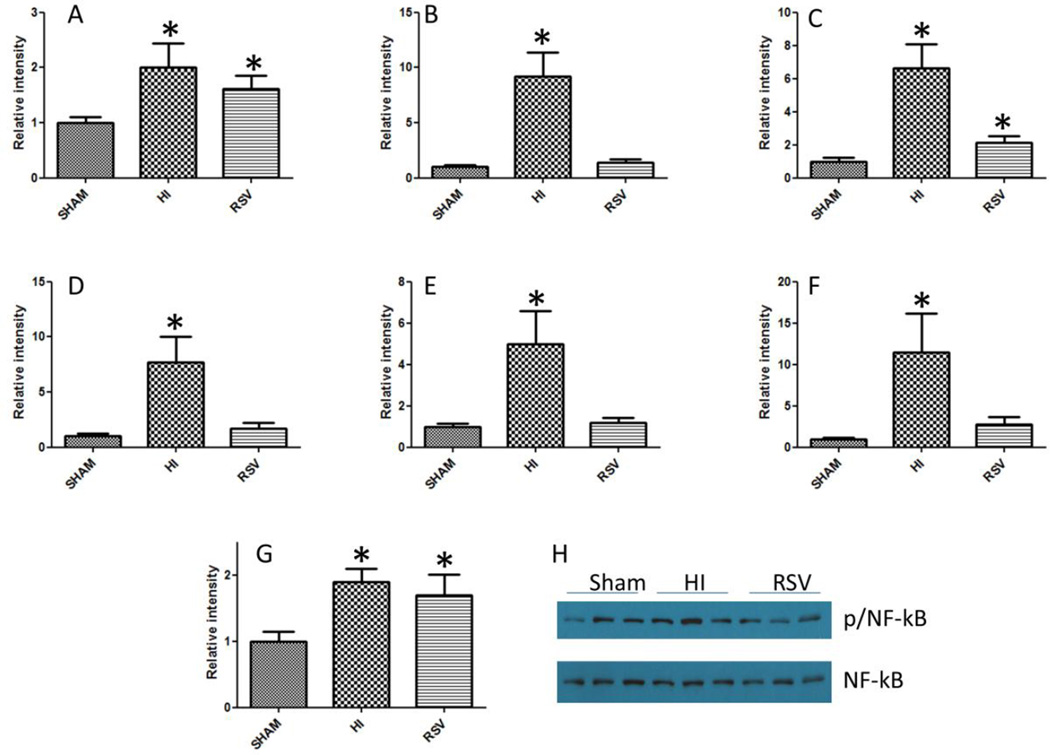
Figure 1. NF-κb and NF-κb regulated cytokine expression in the heart following HI.
NF-κb and NF-κb dependent cytokine gene expression changes following HI and with resveratrol treatment were determined by SYBR green real time PCR amplification of NF-κb p65 (A), IL-2 (B), IL-6 (C), IL-10 (D), TNF-α (E), and MIP-α (F). Panel G shows densitometric data on the ratio of band intensities of p-NF-κb/NF-κb as obtained by Western blot (Panel H). All quantitative results are averages of three sets of experiments. n=5-7; *=p < 0.05; bars indicate mean±SEM.

